32Journal <strong>of</strong> Economic Literature, Vol. XLIX (March 2011)Fourth, <strong>the</strong>re is a concern that tax basedtop <strong>in</strong>come shares also exaggerate <strong>the</strong><strong>in</strong>crease because <strong>of</strong> <strong>in</strong>come shift<strong>in</strong>g toward<strong>the</strong> <strong>in</strong>dividual tax base follow<strong>in</strong>g <strong>the</strong> tax ratereductions on <strong>the</strong> 1980s. Indeed, <strong>the</strong> seriesexclud<strong>in</strong>g capital ga<strong>in</strong>s does display a large4.0 po<strong>in</strong>t upward jump from 1986 to 1988.As is well known (Daniel R. Feenberg <strong>and</strong>James M. Poterba 1993, Saez 2004), almostone-half <strong>of</strong> this jump is due to a shift fromcorporate <strong>in</strong>come toward <strong>in</strong>dividual bus<strong>in</strong>ess<strong>in</strong>come due to <strong>the</strong> Tax Reform Act <strong>of</strong> 1986. 21However, corporate reta<strong>in</strong>ed earn<strong>in</strong>gs translate<strong>in</strong>to capital ga<strong>in</strong>s that are eventually realized<strong>and</strong> reported on <strong>in</strong>dividual tax returns.Therefore, <strong>in</strong> <strong>the</strong> medium run, this shiftwill be matched by an equivalent reduction<strong>in</strong> capital ga<strong>in</strong>s. Indeed, <strong>the</strong> top 1 percent<strong>in</strong>come share series <strong>in</strong>clud<strong>in</strong>g capital ga<strong>in</strong>sdisplay no notable discont<strong>in</strong>uity around <strong>the</strong>TRA 1986 episode (<strong>the</strong> CPS top <strong>in</strong>comeshares <strong>in</strong>crease as fast as <strong>the</strong> tax return basedtop <strong>in</strong>come share <strong>in</strong>clud<strong>in</strong>g capital ga<strong>in</strong>s <strong>in</strong><strong>the</strong> medium run from 1985 to 1990). 22Therefore, from 1976 to 2006 <strong>and</strong> eras<strong>in</strong>g<strong>the</strong> 1992–93 measurement discont<strong>in</strong>uity<strong>in</strong> <strong>the</strong> CPS, <strong>the</strong> CPS top 1 percent shareeffectively misses 10.4 po<strong>in</strong>ts <strong>of</strong> <strong>the</strong> surge<strong>of</strong> <strong>the</strong> top 1 percent <strong>in</strong>come share relativeto <strong>in</strong>come tax data <strong>in</strong>clud<strong>in</strong>g realized capitalga<strong>in</strong>s (<strong>the</strong> most economically mean<strong>in</strong>gfulseries to capture total real top <strong>in</strong>comes). Aswe show on figure 6 <strong>and</strong> table 5 (panel B),this has a substantial impact on <strong>the</strong> <strong>of</strong>ficial21 TRA 1986 made it more advantageous for closelyheld bus<strong>in</strong>esses to shift from corporate to pass-throughentities taxed solely at <strong>the</strong> <strong>in</strong>dividual level. Fur<strong>the</strong>rmore,those firms that rema<strong>in</strong> corporate have an <strong>in</strong>centive to shiftmore <strong>of</strong> <strong>the</strong>ir taxable <strong>in</strong>come to <strong>the</strong> personal tax base. Thiscan be done <strong>in</strong> many ways, e.g., higher royalty payments,payments for rent, higher <strong>in</strong>terest payments, as well ashigher wage payments to entrepreneurs (Roger H. Gordon<strong>and</strong> Joel B. Slemrod 2000).22 The top <strong>in</strong>come share <strong>in</strong>clud<strong>in</strong>g capital ga<strong>in</strong>s isabnormally high <strong>in</strong> 1986 because <strong>of</strong> very large capital ga<strong>in</strong>realizations <strong>in</strong> that year to avoid <strong>the</strong> higher capital ga<strong>in</strong> taxrates after TRA 1986, a well established f<strong>in</strong>d<strong>in</strong>g clearly visibleon figure 3.CPS G<strong>in</strong>i coefficient series over <strong>the</strong> 1976 to2006 period. Three po<strong>in</strong>ts are worth not<strong>in</strong>gon figure 6.First, as mentioned above, <strong>the</strong> <strong>of</strong>ficial CPSG<strong>in</strong>i <strong>in</strong>creased from 39.8 percent <strong>in</strong> 1976to 47.0 percent <strong>in</strong> 2006 <strong>and</strong> this <strong>in</strong>crease<strong>in</strong>cludes a 2 percentage jump from 1992 to1993 due to <strong>the</strong> measurement change discussedabove, so that <strong>the</strong> real <strong>in</strong>crease <strong>in</strong><strong>the</strong> G<strong>in</strong>i is only 5.3 po<strong>in</strong>ts over <strong>the</strong> period(table 5). Second, when exclud<strong>in</strong>g <strong>the</strong> top1 percent, <strong>the</strong> G<strong>in</strong>i for <strong>the</strong> bottom 99 percenthouseholds displays no discont<strong>in</strong>uity atall from 1992 to 1993 which shows that <strong>the</strong>discont<strong>in</strong>uity is entirely due to measurementchanges <strong>with</strong><strong>in</strong> <strong>the</strong> top 1 percent. 23 The G<strong>in</strong>ifor <strong>the</strong> bottom 99 percent <strong>in</strong>creases only by3.2 po<strong>in</strong>ts from 1976 to 2006. Third, whencorrect<strong>in</strong>g <strong>the</strong> G<strong>in</strong>i coefficient us<strong>in</strong>g <strong>the</strong> differential<strong>in</strong> top 1 percent shares between <strong>the</strong>tax data (ei<strong>the</strong>r <strong>in</strong>clud<strong>in</strong>g or exclud<strong>in</strong>g capitalga<strong>in</strong>s) <strong>and</strong> Burkhauser et al. (2009), <strong>the</strong> G<strong>in</strong>icoefficient <strong>in</strong>creases by 10.8 <strong>and</strong> 8.8 po<strong>in</strong>tsrespectively over <strong>the</strong> 1976–2006 period.Us<strong>in</strong>g our preferred series <strong>in</strong>clud<strong>in</strong>g capitalga<strong>in</strong>s, <strong>the</strong> <strong>in</strong>crease <strong>in</strong> <strong>the</strong> G<strong>in</strong>i is 10.8 po<strong>in</strong>ts,i.e., more than twice as large as <strong>the</strong> 5.3 po<strong>in</strong>trecorded <strong>in</strong> <strong>the</strong> G<strong>in</strong>i (after correct<strong>in</strong>g <strong>the</strong>1992–93 discont<strong>in</strong>uity) <strong>and</strong> more than threetimes as large as <strong>the</strong> 3.2 po<strong>in</strong>t <strong>in</strong>crease <strong>in</strong><strong>the</strong> G<strong>in</strong>i for <strong>the</strong> bottom 99 percent. In o<strong>the</strong>rwords, <strong>the</strong> top percentile plays a major role<strong>in</strong> <strong>the</strong> <strong>in</strong>crease <strong>in</strong> <strong>the</strong> G<strong>in</strong>i over <strong>the</strong> last threedecades <strong>and</strong> CPS data that do not measuretop <strong>in</strong>comes fail to capture about half <strong>of</strong> this<strong>in</strong>crease <strong>in</strong> overall <strong>in</strong>equality.23 We have estimated <strong>the</strong> G<strong>in</strong>i for <strong>the</strong> bottom 99percent us<strong>in</strong>g <strong>the</strong> Atk<strong>in</strong>son formula G = (1 − S) G0 + Sfrom Atk<strong>in</strong>son (2007b) where G is <strong>the</strong> G<strong>in</strong>i for <strong>the</strong> full population(Official CPS series), G0 <strong>the</strong> G<strong>in</strong>i for <strong>the</strong> bottom 99percent, <strong>and</strong> S is <strong>the</strong> top 1 percent <strong>in</strong>come share estimatedby Burkhauser et al. (2009). This method is not perfectbecause <strong>the</strong> <strong>of</strong>ficial CPS G<strong>in</strong>i is based on households <strong>and</strong><strong>in</strong>come <strong>in</strong>clud<strong>in</strong>g cash transfers while Burkhauser et al. top1 percent <strong>in</strong>come share is based on families <strong>and</strong> excludescash transfers.
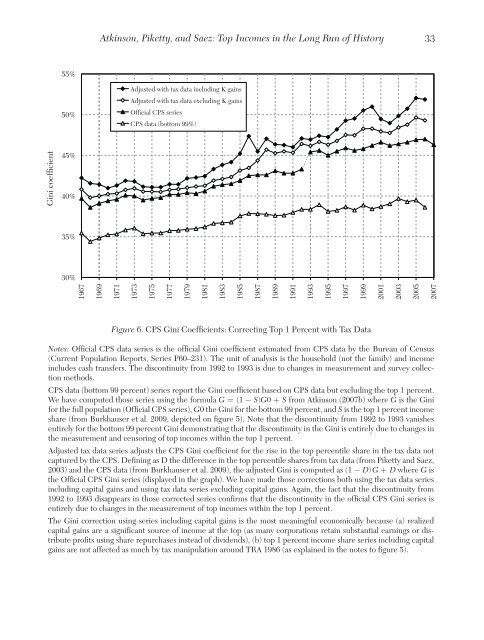
Atk<strong>in</strong>son, Piketty, <strong>and</strong> Saez: <strong>Top</strong> <strong>Incomes</strong> <strong>in</strong> <strong>the</strong> <strong>Long</strong> <strong>Run</strong> <strong>of</strong> History3355%50%Adjusted <strong>with</strong> tax data <strong>in</strong>clud<strong>in</strong>g K ga<strong>in</strong>sAdjusted <strong>with</strong> tax data exclud<strong>in</strong>g K ga<strong>in</strong>sOfficial CPS seriesCPS data (bottom 99%)45%40%35%30%196719691971197319751977197919811983198519871989199119931995199719992001200320052007G<strong>in</strong>i coefficientFigure 6. CPS G<strong>in</strong>i Coefficients: Correct<strong>in</strong>g <strong>Top</strong> 1 Percent <strong>with</strong> Tax DataNotes: Official CPS data series is <strong>the</strong> <strong>of</strong>ficial G<strong>in</strong>i coefficient estimated from CPS data by <strong>the</strong> Bureau <strong>of</strong> Census(Current Population Reports, Series P60–231). The unit <strong>of</strong> analysis is <strong>the</strong> household (not <strong>the</strong> family) <strong>and</strong> <strong>in</strong>come<strong>in</strong>cludes cash transfers. The discont<strong>in</strong>uity from 1992 to 1993 is due to changes <strong>in</strong> measurement <strong>and</strong> survey collectionmethods.CPS data (bottom 99 percent) series report <strong>the</strong> G<strong>in</strong>i coefficient based on CPS data but exclud<strong>in</strong>g <strong>the</strong> top 1 percent.We have computed those series us<strong>in</strong>g <strong>the</strong> formula G = (1 − S)G0 + S from Atk<strong>in</strong>son (2007b) where G is <strong>the</strong> G<strong>in</strong>ifor <strong>the</strong> full population (Official CPS series), G0 <strong>the</strong> G<strong>in</strong>i for <strong>the</strong> bottom 99 percent, <strong>and</strong> S is <strong>the</strong> top 1 percent <strong>in</strong>comeshare (from Burkhauser et al. 2009, depicted on figure 5). Note that <strong>the</strong> discont<strong>in</strong>uity from 1992 to 1993 vanishesentirely for <strong>the</strong> bottom 99 percent G<strong>in</strong>i demonstrat<strong>in</strong>g that <strong>the</strong> discont<strong>in</strong>uity <strong>in</strong> <strong>the</strong> G<strong>in</strong>i is entirely due to changes <strong>in</strong><strong>the</strong> measurement <strong>and</strong> censor<strong>in</strong>g <strong>of</strong> top <strong>in</strong>comes <strong>with</strong><strong>in</strong> <strong>the</strong> top 1 percent.Adjusted tax data series adjusts <strong>the</strong> CPS G<strong>in</strong>i coefficient for <strong>the</strong> rise <strong>in</strong> <strong>the</strong> top percentile share <strong>in</strong> <strong>the</strong> tax data notcaptured by <strong>the</strong> CPS. Def<strong>in</strong><strong>in</strong>g as D <strong>the</strong> difference <strong>in</strong> <strong>the</strong> top percentile shares from tax data (from Piketty <strong>and</strong> Saez,2003) <strong>and</strong> <strong>the</strong> CPS data (from Burkhauser et al. 2009), <strong>the</strong> adjusted G<strong>in</strong>i is computed as (1 − D) G + D where G is<strong>the</strong> Official CPS G<strong>in</strong>i series (displayed <strong>in</strong> <strong>the</strong> graph). We have made those corrections both us<strong>in</strong>g <strong>the</strong> tax data series<strong>in</strong>clud<strong>in</strong>g capital ga<strong>in</strong>s <strong>and</strong> us<strong>in</strong>g tax data series exclud<strong>in</strong>g capital ga<strong>in</strong>s. Aga<strong>in</strong>, <strong>the</strong> fact that <strong>the</strong> discont<strong>in</strong>uity from1992 to 1993 disappears <strong>in</strong> those corrected series confirms that <strong>the</strong> discont<strong>in</strong>uity <strong>in</strong> <strong>the</strong> <strong>of</strong>ficial CPS G<strong>in</strong>i series isentirely due to changes <strong>in</strong> <strong>the</strong> measurement <strong>of</strong> top <strong>in</strong>comes <strong>with</strong><strong>in</strong> <strong>the</strong> top 1 percent.The G<strong>in</strong>i correction us<strong>in</strong>g series <strong>in</strong>clud<strong>in</strong>g capital ga<strong>in</strong>s is <strong>the</strong> most mean<strong>in</strong>gful economically because (a) realizedcapital ga<strong>in</strong>s are a significant source <strong>of</strong> <strong>in</strong>come at <strong>the</strong> top (as many corporations reta<strong>in</strong> substantial earn<strong>in</strong>gs or distributepr<strong>of</strong>its us<strong>in</strong>g share repurchases <strong>in</strong>stead <strong>of</strong> dividends), (b) top 1 percent <strong>in</strong>come share series <strong>in</strong>clud<strong>in</strong>g capitalga<strong>in</strong>s are not affected as much by tax manipulation around TRA 1986 (as expla<strong>in</strong>ed <strong>in</strong> <strong>the</strong> notes to figure 5).
- Page 5 and 6: Atkinson, Piketty, and Saez: Top In
- Page 7 and 8: Atkinson, Piketty, and Saez: Top In
- Page 9 and 10: Atkinson, Piketty, and Saez: Top In
- Page 11 and 12: Atkinson, Piketty, and Saez: Top In
- Page 13 and 14: Atkinson, Piketty, and Saez: Top In
- Page 15 and 16: Atkinson, Piketty, and Saez: Top In
- Page 17 and 18: Atkinson, Piketty, and Saez: Top In
- Page 19 and 20: Atkinson, Piketty, and Saez: Top In
- Page 21 and 22: Atkinson, Piketty, and Saez: Top In
- Page 23 and 24: Atkinson, Piketty, and Saez: Top In
- Page 25 and 26: Atkinson, Piketty, and Saez: Top In
- Page 27 and 28: Atkinson, Piketty, and Saez: Top In
- Page 29: Atkinson, Piketty, and Saez: Top In
- Page 33 and 34: Atkinson, Piketty, and Saez: Top In
- Page 35 and 36: Atkinson, Piketty, and Saez: Top In
- Page 37 and 38: Atkinson, Piketty, and Saez: Top In
- Page 39 and 40: Atkinson, Piketty, and Saez: Top In
- Page 41 and 42: Atkinson, Piketty, and Saez: Top In
- Page 43 and 44: Atkinson, Piketty, and Saez: Top In
- Page 45 and 46: Atkinson, Piketty, and Saez: Top In
- Page 47 and 48: Atkinson, Piketty, and Saez: Top In
- Page 49 and 50: Atkinson, Piketty, and Saez: Top In
- Page 51 and 52: Atkinson, Piketty, and Saez: Top In
- Page 53 and 54: Atkinson, Piketty, and Saez: Top In
- Page 55 and 56: Atkinson, Piketty, and Saez: Top In
- Page 57 and 58: Atkinson, Piketty, and Saez: Top In
- Page 59 and 60: Atkinson, Piketty, and Saez: Top In
- Page 61 and 62: Atkinson, Piketty, and Saez: Top In
- Page 63 and 64: Atkinson, Piketty, and Saez: Top In
- Page 65 and 66: Atkinson, Piketty, and Saez: Top In
- Page 67 and 68: Atkinson, Piketty, and Saez: Top In
- Page 69: Atkinson, Piketty, and Saez: Top In