"Top Incomes in the Long Run of History" with Tony Atkinson and
"Top Incomes in the Long Run of History" with Tony Atkinson and
"Top Incomes in the Long Run of History" with Tony Atkinson and

You also want an ePaper? Increase the reach of your titles
YUMPU automatically turns print PDFs into web optimized ePapers that Google loves.
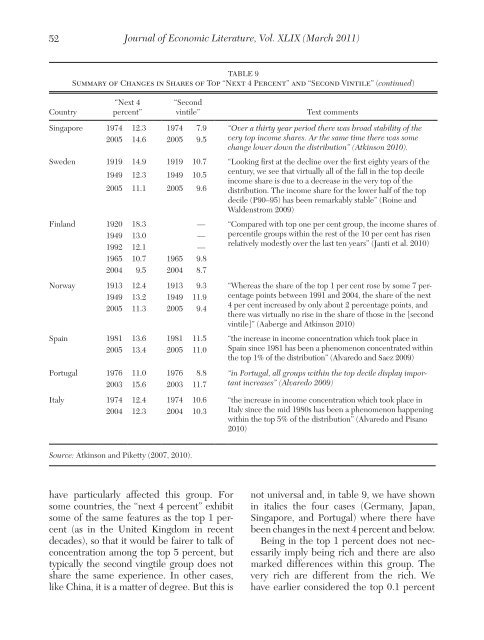
52Journal <strong>of</strong> Economic Literature, Vol. XLIX (March 2011)CountryTable 9Summary <strong>of</strong> Changes <strong>in</strong> Shares <strong>of</strong> <strong>Top</strong> “Next 4 Percent” <strong>and</strong> “Second V<strong>in</strong>tile” (cont<strong>in</strong>ued)“Next 4percent”“Secondv<strong>in</strong>tile”Text commentsS<strong>in</strong>gapore 1974 12.3 1974 7.9 “Over a thirty year period <strong>the</strong>re was broad stability <strong>of</strong> <strong>the</strong>2005 14.6 2005 9.5 very top <strong>in</strong>come shares. Ar <strong>the</strong> same time <strong>the</strong>re was somechange lower down <strong>the</strong> distribution” (Atk<strong>in</strong>son 2010).Sweden 1919 14.9 1919 10.7 “Look<strong>in</strong>g first at <strong>the</strong> decl<strong>in</strong>e over <strong>the</strong> first eighty years <strong>of</strong> <strong>the</strong>1949 12.3 1949 10.5century, we see that virtually all <strong>of</strong> <strong>the</strong> fall <strong>in</strong> <strong>the</strong> top decile<strong>in</strong>come share is due to a decrease <strong>in</strong> <strong>the</strong> very top <strong>of</strong> <strong>the</strong>2005 11.1 2005 9.6 distribution. The <strong>in</strong>come share for <strong>the</strong> lower half <strong>of</strong> <strong>the</strong> topdecile (P90–95) has been remarkably stable” (Ro<strong>in</strong>e <strong>and</strong>Waldenstrom 2009)F<strong>in</strong>l<strong>and</strong> 1920 18.3 — “Compared <strong>with</strong> top one per cent group, <strong>the</strong> <strong>in</strong>come shares <strong>of</strong>1949 13.0 — percentile groups <strong>with</strong><strong>in</strong> <strong>the</strong> rest <strong>of</strong> <strong>the</strong> 10 per cent has risen1992 12.1 —relatively modestly over <strong>the</strong> last ten years” (Janti et al. 2010)1965 10.7 1965 9.82004 9.5 2004 8.7Norway 1913 12.4 1913 9.3 “Whereas <strong>the</strong> share <strong>of</strong> <strong>the</strong> top 1 per cent rose by some 7 percentagepo<strong>in</strong>ts between 1991 <strong>and</strong> 2004, <strong>the</strong> share <strong>of</strong> <strong>the</strong> next1949 13.2 1949 11.92005 11.3 2005 9.44 per cent <strong>in</strong>creased by only about 2 percentage po<strong>in</strong>ts, <strong>and</strong><strong>the</strong>re was virtually no rise <strong>in</strong> <strong>the</strong> share <strong>of</strong> those <strong>in</strong> <strong>the</strong> [secondv<strong>in</strong>tile]” (Aaberge <strong>and</strong> Atk<strong>in</strong>son 2010)Spa<strong>in</strong> 1981 13.6 1981 11.5 “<strong>the</strong> <strong>in</strong>crease <strong>in</strong> <strong>in</strong>come concentration which took place <strong>in</strong>2005 13.4 2005 11.0 Spa<strong>in</strong> s<strong>in</strong>ce 1981 has been a phenomenon concentrated <strong>with</strong><strong>in</strong><strong>the</strong> top 1% <strong>of</strong> <strong>the</strong> distribution” (Alvaredo <strong>and</strong> Saez 2009)Portugal 1976 11.0 1976 8.8 “<strong>in</strong> Portugal, all groups <strong>with</strong><strong>in</strong> <strong>the</strong> top decile display important2003 15.6 2003 11.7<strong>in</strong>creases” (Alvaredo 2009)Italy 1974 12.4 1974 10.6 “<strong>the</strong> <strong>in</strong>crease <strong>in</strong> <strong>in</strong>come concentration which took place <strong>in</strong>2004 12.3 2004 10.3 Italy s<strong>in</strong>ce <strong>the</strong> mid 1980s has been a phenomenon happen<strong>in</strong>g<strong>with</strong><strong>in</strong> <strong>the</strong> top 5% <strong>of</strong> <strong>the</strong> distribution” (Alvaredo <strong>and</strong> Pisano2010)Source: Atk<strong>in</strong>son <strong>and</strong> Piketty (2007, 2010).have particularly affected this group. Forsome countries, <strong>the</strong> “next 4 percent” exhibitsome <strong>of</strong> <strong>the</strong> same features as <strong>the</strong> top 1 percent(as <strong>in</strong> <strong>the</strong> United K<strong>in</strong>gdom <strong>in</strong> recentdecades), so that it would be fairer to talk <strong>of</strong>concentration among <strong>the</strong> top 5 percent, buttypically <strong>the</strong> second v<strong>in</strong>gtile group does notshare <strong>the</strong> same experience. In o<strong>the</strong>r cases,like Ch<strong>in</strong>a, it is a matter <strong>of</strong> degree. But this isnot universal <strong>and</strong>, <strong>in</strong> table 9, we have shown<strong>in</strong> italics <strong>the</strong> four cases (Germany, Japan,S<strong>in</strong>gapore, <strong>and</strong> Portugal) where <strong>the</strong>re havebeen changes <strong>in</strong> <strong>the</strong> next 4 percent <strong>and</strong> below.Be<strong>in</strong>g <strong>in</strong> <strong>the</strong> top 1 percent does not necessarilyimply be<strong>in</strong>g rich <strong>and</strong> <strong>the</strong>re are alsomarked differences <strong>with</strong><strong>in</strong> this group. Thevery rich are different from <strong>the</strong> rich. Wehave earlier considered <strong>the</strong> top 0.1 percent