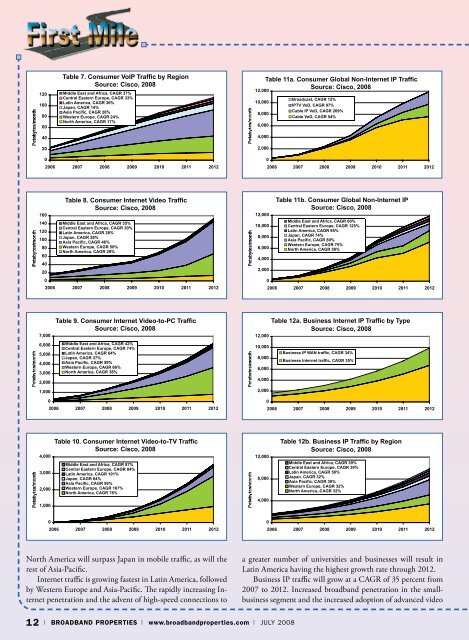
12010080604020Table 7. Consumer VoIP Traffic by RegionSource: Cisco, 2008Middle East and Africa, CAGR 37%Central Eastern Europe, CAGR 33%Latin America, CAGR 36%Japan, CAGR 14%Asia Pacific, CAGR 28%Western Europe, CAGR 24%North America, CAGR 17%12,00010,0008,0006,0004,0002,000Table 11a. Consumer Global Non-Internet IP TrafficSource: Cisco, 2008Broadcast, CAGR 12%IPTV VoD, CAGR 97%Cable IP VoD, CAGR 269%Cable VoD, CAGR 54%02006 2007 2008 2009 2010 2011 201202006 2007 2008 2009 2010 2011 2012160140120100806040200Table 8. Consumer Internet Video TrafficSource: Cisco, 2008Middle East and Africa, CAGR 35%Central Eastern Europe, CAGR 30%Latin America, CAGR 28%Japan, CAGR 28%Asia Pacific, CAGR 46%Western Europe, CAGR 50%North America, CAGR 29%2006 2007 2008 2009 2010 2011 201212,00010,0008,0006,0004,0002,0000Table 11b. Consumer Global Non-Internet IPSource: Cisco, 2008Middle East and Africa, CAGR 60%Central Eastern Europe, CAGR 125%Latin America, CAGR 95%Japan, CAGR 74%Asia Pacific, CAGR 80%Western Europe, CAGR 75%North America, CAGR 58%2006 2007 2008 2009 2010 2011 20127,0006,0005,0004,0003,0002,0001,0000Table 9. Consumer Internet Video-to-PC TrafficSource: Cisco, 2008Middle East and Africa, CAGR 42%Central Eastern Europe, CAGR 74%Latin America, CAGR 64%Japan, CAGR 37%Asia Pacific, CAGR 59%Western Europe, CAGR 66%North America, CAGR 38%2006 2007 2008 2009 2010 2011 201212,00010,0008,0006,0004,0002,0000Table 12a. Business Internet IP Traffic by TypeSource: Cisco, 2008Business IP WAN traffic, CAGR 34%Business Internet traffic, CAGR 35%2006 2007 2008 2009 2010 2011 20124,0003,0002,0001,000Table 10. Consumer Internet Video-to-TV TrafficSource: Cisco, 2008Middle East and Africa, CAGR 87%Central Eastern Europe, CAGR 84%Latin America, CAGR 101%Japan, CAGR 64%Asia Pacific, CAGR 96%Western Europe, CAGR 167%North America, CAGR 78%12,0008,0004,000Table 12b. Business IP Traffic by RegionSource: Cisco, 2008Middle East and Africa, CAGR 39%Central Eastern Europe, CAGR 39%Latin America, CAGR 50%Japan, CAGR 32%Asia Pacific, CAGR 38%Western Europe, CAGR 32%North America,-CAGR 32%02006 2007 2008 2009 2010 2011 201202006 2007 2008 2009 2010 2011 2012North America will surpass Japan in mobile traffic, as will therest of Asia-Pacific.Internet traffic is growing fastest in Latin America, followedby Western Europe and Asia-Pacific. The rapidly increasing Internetpenetration and the advent of high-speed connections toa greater number of universities and businesses will result inLatin America having the highest growth rate through 2012.Business IP traffic will grow at a CAGR of 35 percent from2007 to 2012. Increased broadband penetration in the smallbusinesssegment and the increased adoption of advanced video12 | BROADBAND PROPERTIES | www.broadbandproperties.com | July 2008
1,5001,2009006003000Table 13. Mobile Data and Internet TrafficSource: Cisco, 2008Middle East and Africa, CAGR 133%Central Eastern Europe, CAGR 99%Latin America, CAGR 199%Japan, CAGR 82%Asia Pacific, CAGR 125%Western Europe, CAGR 171%North America, CAGR 116%2006 2007 2008 2009 2010 2011 2012communications in the enterprise segment will result in aCAGR of 35 percent for business IP traffic from 2007 to 2012.Business Internet traffic will grow fastest in developingmarkets and Asia-Pacific. North America, Western Europe andJapan will have slower growth rates. In volume, North Americawill continue to have the most business IP traffic through 2011,followed by Western Europe and Asia-Pacific.Global IP Traffic Growth 2006–2011The charts derived by <strong>Broadband</strong> <strong>Properties</strong> from Table 1 inthe Cisco report show the top-line forecast. Global IP trafficin 2008 stands at more than 10 exabytes per month, forecastto more than quadruple, reaching 44 exabytes per month in2012. Consumer IP traffic will exceed 32 exabytes per month,business IP traffic will approach 10 exabytes per month, andmobility traffic will exceed 1.6 exabyte per month.In the charts:• Consumer: includes fixed IP traffic generated by households,university populations and Internet cafés• Business: includes fixed IP WAN or Internet traffic, excludingbackup traffic, generated by businesses and governments.• Mobility: includes mobile data and Internet traffic generatedby handsets, notebook cards, WiMAX• Internet: denotes all IP traffic that crosses an Internet backbone.• Non-Internet IP: includes corporate IP WAN traffic, IPtransport of TV/VoD, and mobile “walled garden” traffic.The forecast relies on analyst projections for Internet users,broadband connections, video subscribers, mobile connections,and Internet application adoption from Kagan, Ovum,Informa, IDC, Gartner, ABI, AMI, Screendigest, and ParksAssociates.Consumer IP Traffic 2006–2012As shown in the chart for Table 2, global consumer IP trafficis expected to surpass 32 exabytes per month in 2012. Themajority of today’s consumer IP traffic is Internet traffic, butconsumer IPTV and VoD traffic will grow more rapidly at aCAGR of more than 68 percent.The charts for Table 3, Consumer Internet Traffic, encompassany IP traffic that crosses the Internet and is not confinedto a single service provider’s network. Peer-to-peer (P2P) traffic,still the largest share of Internet traffic today, will decrease as apercentage of overall Internet traffic. Internet video streamingand downloads are beginning to take a larger share of bandwidth,and will grow to nearly 50 percent of all consumer Internettraffic in 2012.In the charts:• Web, Email, and Data: includes web, email, instant messaging,newsgroups and file transfer (excluding P2P and commercialfile transfer such as iTunes).• P2P: includes peer-to-peer traffic from all recognized P2Psystems such as BitTorrent.• Gaming: includes casual online gaming, networked consolegaming, and multiplayer virtual world gaming.• Video Communications: includes PC-based video calling,webcam viewing, and Web-based video monitoring.• VoIP: includes traffic from retail VoIP services and PC-basedVoIP, but excludes wholesale VoIP transport.• Internet Video to PC: free or pay TV or VoD viewed on aPC, excludes P2P video file downloads.• Internet Video to TV: free or pay TV or VoD delivered viaInternet but viewed on a TV screen using a set-top box ormedia gateway.“Data” may include the download of video files that are notcaptured by the “Internet video to PC” forecast. It includestraffic generated by all individual Internet users. An Inter-“Opportunities multiplyas they are seized.”— Sun Tzu, The Art of WarApril 27 – 29, 2009New Profit Opportunities:LIVING - WORKING - PLAYINGNOW OPENFOR GENERAL SALE: Booths Sponsorships Special PromotionsCall Irene now to secure your participation.To Exhibit or Sponsor, contact:Irene Gonzales atirene@broadbandproperties.com,or call 316-733-9122.For other inquiries, call 877-588-1649, or visit www.bbpmag.comJuly 2008 | www.broadbandproperties.com | BROADBAND PROPERTIES | 13