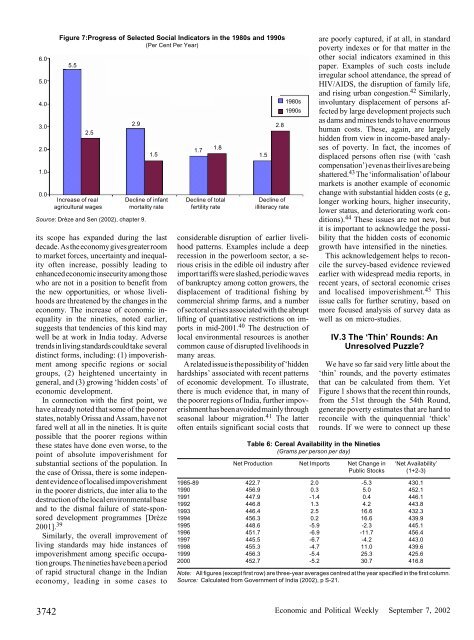
6.05.04.03.02.01.00.0Figure 7:Progress of Selected Social Indicators <strong>in</strong> the 1980s <strong>and</strong> 1990s(Per Cent Per Year)5.52.52.9Increase of real Decl<strong>in</strong>e of <strong>in</strong>fant Decl<strong>in</strong>e of total Decl<strong>in</strong>e ofagricultural wages mortality rate fertility rate illiteracy rateSource: Drèze <strong>and</strong> Sen (2002), chapter 9.1.5its scope has exp<strong>and</strong>ed dur<strong>in</strong>g the lastdecade. As the economy gives greater roomto market forces, uncerta<strong>in</strong>ty <strong>and</strong> <strong>in</strong>equalityoften <strong>in</strong>crease, possibly lead<strong>in</strong>g toenhanced economic <strong>in</strong>security among thosewho are not <strong>in</strong> a position to benefit fromthe new opportunities, or whose livelihoodsare threatened by the changes <strong>in</strong> theeconomy. The <strong>in</strong>crease of economic <strong>in</strong>equality<strong>in</strong> the n<strong>in</strong>eties, noted earlier,suggests that tendencies of this k<strong>in</strong>d maywell be at work <strong>in</strong> <strong>India</strong> today. Adversetrends <strong>in</strong> liv<strong>in</strong>g st<strong>and</strong>ards could take severaldist<strong>in</strong>ct forms, <strong>in</strong>clud<strong>in</strong>g: (1) impoverishmentamong specific regions or socialgroups, (2) heightened uncerta<strong>in</strong>ty <strong>in</strong>general, <strong>and</strong> (3) grow<strong>in</strong>g ‘hidden costs’ ofeconomic development.In connection with the first po<strong>in</strong>t, wehave already noted that some of the poorerstates, notably Orissa <strong>and</strong> Assam, have notfared well at all <strong>in</strong> the n<strong>in</strong>eties. It is quitepossible that the poorer regions with<strong>in</strong>these states have done even worse, to thepo<strong>in</strong>t of absolute impoverishment forsubstantial sections of the population. Inthe case of Orissa, there is some <strong>in</strong>dependentevidence of localised impoverishment<strong>in</strong> the poorer districts, due <strong>in</strong>ter alia to thedestruction of the local environmental base<strong>and</strong> to the dismal failure of state-sponsoreddevelopment programmes [Drèze2001]. 39Similarly, the overall improvement ofliv<strong>in</strong>g st<strong>and</strong>ards may hide <strong>in</strong>stances ofimpoverishment among specific occupationgroups. The n<strong>in</strong>eties have been a periodof rapid structural change <strong>in</strong> the <strong>India</strong>neconomy, lead<strong>in</strong>g <strong>in</strong> some cases to1.71.81.52.81980s1990sconsiderable disruption of earlier livelihoodpatterns. Examples <strong>in</strong>clude a deeprecession <strong>in</strong> the powerloom sector, a seriouscrisis <strong>in</strong> the edible oil <strong>in</strong>dustry afterimport tariffs were slashed, periodic wavesof bankruptcy among cotton growers, thedisplacement of traditional fish<strong>in</strong>g bycommercial shrimp farms, <strong>and</strong> a numberof sectoral crises associated with the abruptlift<strong>in</strong>g of quantitative restrictions on imports<strong>in</strong> mid-2001. 40 The destruction oflocal environmental resources is anothercommon cause of disrupted livelihoods <strong>in</strong>many areas.A related issue is the possibility of ‘hiddenhardships’ associated with recent patternsof economic development. To illustrate,there is much evidence that, <strong>in</strong> many ofthe poorer regions of <strong>India</strong>, further impoverishmenthas been avoided ma<strong>in</strong>ly throughseasonal labour migration. 41 The latteroften entails significant social costs thatTable 6: Cereal Availability <strong>in</strong> the N<strong>in</strong>eties(Grams per person per day)are poorly captured, if at all, <strong>in</strong> st<strong>and</strong>ardpoverty <strong>in</strong>dexes or for that matter <strong>in</strong> theother social <strong>in</strong>dicators exam<strong>in</strong>ed <strong>in</strong> thispaper. Examples of such costs <strong>in</strong>cludeirregular school attendance, the spread ofHIV/AIDS, the disruption of family life,<strong>and</strong> ris<strong>in</strong>g urban congestion. 42 Similarly,<strong>in</strong>voluntary displacement of persons affectedby large development projects suchas dams <strong>and</strong> m<strong>in</strong>es tends to have enormoushuman costs. These, aga<strong>in</strong>, are largelyhidden from view <strong>in</strong> <strong>in</strong>come-based analysesof poverty. In fact, the <strong>in</strong>comes ofdisplaced persons often rise (with ‘cashcompensation’) even as their lives are be<strong>in</strong>gshattered. 43 The ‘<strong>in</strong>formalisation’ of labourmarkets is another example of economicchange with substantial hidden costs (e g,longer work<strong>in</strong>g hours, higher <strong>in</strong>security,lower status, <strong>and</strong> deteriorat<strong>in</strong>g work conditions).44 These issues are not new, butit is important to acknowledge the possibilitythat the hidden costs of economicgrowth have <strong>in</strong>tensified <strong>in</strong> the n<strong>in</strong>eties.This acknowledgement helps to reconcilethe survey-based evidence reviewedearlier with widespread media reports, <strong>in</strong>recent years, of sectoral economic crises<strong>and</strong> localised impoverishment. 45 Thisissue calls for further scrut<strong>in</strong>y, based onmore focused analysis of survey data aswell as on micro-studies.IV.3 The ‘Th<strong>in</strong>’ Rounds: AnUnresolved Puzzle?We have so far said very little about the‘th<strong>in</strong>’ rounds, <strong>and</strong> the poverty estimatesthat can be calculated from them. YetFigure 1 shows that the recent th<strong>in</strong> rounds,from the 51st through the 54th Round,generate poverty estimates that are hard toreconcile with the qu<strong>in</strong>quennial ‘thick’rounds. If we were to connect up theseNet Production Net Imports Net Change <strong>in</strong> ‘Net Availability’Public Stocks (1+2-3)1985-89 422.7 2.0 -5.3 430.11990 456.9 0.3 5.0 452.11991 447.9 -1.4 0.4 446.11992 446.8 1.3 4.2 443.81993 446.4 2.5 16.6 432.31994 456.3 0.2 16.6 439.91995 448.6 -5.9 -2.3 445.11996 451.7 -6.9 -11.7 456.41997 445.5 -6.7 -4.2 443.01998 455.3 -4.7 11.0 439.61999 456.3 -5.4 25.3 425.62000 452.7 -5.2 30.7 416.8Note: All figures (except first row) are three-year averages centred at the year specified <strong>in</strong> the first column.Source: Calculated from Government of <strong>India</strong> (2002), p S-21.3742Economic <strong>and</strong> Political Weekly September 7, 2002
po<strong>in</strong>ts with the official HCR estimates, wewould get a series <strong>in</strong> which poverty rosebetween 1993-94 <strong>and</strong> 1994-95, fell from1994-95 to the end of 1997, rose verysharply <strong>in</strong> the first half of 1998, <strong>and</strong> thenfell with extraord<strong>in</strong>ary rapidity <strong>in</strong> 1999-2000. As we have seen, the official estimatefor 1999-2000 is too low, <strong>and</strong> the lastth<strong>in</strong> round, the 54th Round, ran for onlythe first six months of 1998, <strong>and</strong> maytherefore not be fully comparable withother rounds. Even so, <strong>and</strong> with due allowancefor corrections, it is very hard to<strong>in</strong>tegrate the poverty estimates based onthe th<strong>in</strong> rounds with the picture that emergesfrom the thick rounds as well as from othersources surveyed <strong>in</strong> this paper.The story is further complicated by thefact that these th<strong>in</strong> rounds were run <strong>in</strong> twoversions, one of which resembled thest<strong>and</strong>ard questionnaire up to <strong>and</strong> <strong>in</strong>clud<strong>in</strong>gthe 50th Round, <strong>and</strong> one of which – theexperimental questionnaire – had differentreport<strong>in</strong>g periods for different goods.Headcount ratios based on the experimentalquestionnaire (not shown <strong>in</strong> Figure 1)are lower than those from the st<strong>and</strong>ardquestionnaire, because the experimentalquestionnaire generated higher reports ofper capita expenditure. However, they alsoshow ris<strong>in</strong>g HCRs from the 52nd throughthe 54th Rounds, <strong>and</strong> the <strong>in</strong>crease cont<strong>in</strong>ues<strong>in</strong>to the 55th Round if we use comparablereport<strong>in</strong>g periods from that round.Based on the experimental questionnaire,a case could be made that the all-<strong>India</strong>HCR has been ris<strong>in</strong>g s<strong>in</strong>ce 1995-96 [Sen2000]. As we have seen, there are goodgrounds for distrust<strong>in</strong>g the experimentalquestionnaire <strong>in</strong> the 55th Round, becauseof the juxtaposition of the seven-day recall<strong>and</strong> 30-day recall data for food-pan <strong>and</strong>tobacco. Quite likely, the ‘reconciliationeffect’ (see Section I.1) pulled down theestimates of per capita expenditure fromthe experimental questionnaire, thus exaggerat<strong>in</strong>gpoverty by this count. Even so,if poverty were genu<strong>in</strong>ely fall<strong>in</strong>g, there isno obvious explanation why the experimentalquestionnaire should show a rise<strong>in</strong> poverty from 1995 through 1998.The Plann<strong>in</strong>g Commission has neverendorsed poverty counts from the th<strong>in</strong>rounds. In part, this has been because ofthe smaller sample sizes. The Plann<strong>in</strong>gCommission needs estimates of HCRs, notjust for all-<strong>India</strong>, but for <strong>in</strong>dividual states,<strong>and</strong> the th<strong>in</strong> rounds are not large enough tosupport accurate estimates for some of thesmaller (of the major) states. But <strong>in</strong>adequatesample size generates variance,not bias, <strong>and</strong> <strong>in</strong> any case, the th<strong>in</strong> roundsample sizes are perfectly adequate togenerate accurate estimates for the all-<strong>India</strong> HCRs. The discrepancies <strong>in</strong> Figure 1cannot be expla<strong>in</strong>ed by <strong>in</strong>adequatesample sizes.There are other differences between thick<strong>and</strong> th<strong>in</strong> rounds. For example, the sampl<strong>in</strong>gframe for the 51st, 53rd, <strong>and</strong> 54thRounds was not the census of population,but the ‘economic’ census. In the populationcensus, each household is asked ifit has a family bus<strong>in</strong>ess or enterprise, <strong>and</strong>only such households are <strong>in</strong>cluded <strong>in</strong> thefirst-stage sampl<strong>in</strong>g from the economiccensus when ‘first-stage units’ are drawnwith probability proportional to size. Thismeans that a village with few or no suchhouseholds has only a small or no chanceof be<strong>in</strong>g selected as a first-stage unit. Evenso, when the team reaches the village, allhouseholds are listed <strong>and</strong> have a chanceof be<strong>in</strong>g <strong>in</strong> the sample, so it is unclear thatthis choice of frame makes much difference.Indeed, comparison of various socioeconomic<strong>in</strong>dicators (e g, literacy rates,years of school<strong>in</strong>g, l<strong>and</strong>hold<strong>in</strong>g, or familysize) from the surveys suggests no obviousbreaks between the 51st <strong>and</strong> 53rd Roundson the one h<strong>and</strong>, <strong>and</strong> the 52nd Round(which used the population census) on theother. Conversations with NSS <strong>and</strong> Plann<strong>in</strong>gCommission staff sometimes suggestthat there may be other (non-documented)differences <strong>in</strong> the sampl<strong>in</strong>g structure of theth<strong>in</strong> rounds. Certa<strong>in</strong>ly, a tabulation of thepopulation sizes of the first-stage unitsshows that the 52nd Round conta<strong>in</strong>edrelatively few large units compared withthe 51st, 53rd, 54th, <strong>and</strong> 55th rounds; thisis a different issue from the use of theeconomic rather than population census(both the 52nd <strong>and</strong> 55th Rounds use thelatter), <strong>and</strong> the f<strong>in</strong>d<strong>in</strong>g suggests that thefirst-stage units <strong>in</strong> the 52nd Round wereselected differently from other rounds <strong>in</strong>some way that is not documented. Moreover,the measurement of consumption isnot the ma<strong>in</strong> purpose of any of these th<strong>in</strong>rounds, all of which have some otherobjective, so it is possible that consumptionis not so fully or carefully collectedas <strong>in</strong> the qu<strong>in</strong>quennial rounds.In short, there are grounds for scepticismabout the validity of the th<strong>in</strong> rounds forpoverty estimation purposes, <strong>and</strong> this is allthe more so if we remember that aside from<strong>in</strong>dicat<strong>in</strong>g no poverty decl<strong>in</strong>e <strong>in</strong> the laten<strong>in</strong>eties, the th<strong>in</strong> rounds also suggest thataverage per capita expenditure was stagnat<strong>in</strong>gdur<strong>in</strong>g that period – someth<strong>in</strong>g thatis very hard to reconcile with other evidence.Hav<strong>in</strong>g said this, we have not beenable to identify any ‘smok<strong>in</strong>g gun’ thatwould po<strong>in</strong>t to a specific problem with anyof these rounds <strong>and</strong> expla<strong>in</strong> their apparentlyanomalous poverty estimates. Untilthat puzzle is resolved, we see the evidencefrom the th<strong>in</strong> rounds as cast<strong>in</strong>g a shadowof doubt over the <strong>in</strong>terpretation of thepoverty estimates presented earlier <strong>in</strong> thispaper. Perhaps the th<strong>in</strong> rounds <strong>in</strong> the nextfive years will offer some useful clues.VBeyond <strong>Poverty</strong> IndexesThe decl<strong>in</strong>e of poverty <strong>in</strong> the n<strong>in</strong>eties,as captured <strong>in</strong> the <strong>in</strong>dicators exam<strong>in</strong>ed sofar, can be seen as an example of cont<strong>in</strong>uedprogress dur<strong>in</strong>g that period. Whether therate of progress has been faster or slowerthan <strong>in</strong> the eighties is difficult to say, <strong>and</strong>the answer is likely to depend on how therate of progress is measured. There is, atany rate, no obvious pattern of “acceleration”or ‘slowdown’ <strong>in</strong> this respect.It is important to supplement the evidencereviewed so far, which essentiallyrelates to purchas<strong>in</strong>g power, with other<strong>in</strong>dicators of well-be<strong>in</strong>g relat<strong>in</strong>g, for <strong>in</strong>stanceto educational achievements, lifeexpectancy, nutritional levels, crime rates,<strong>and</strong> various aspects of social <strong>in</strong>equality.This broader perspective reveals that socialprogress <strong>in</strong> the n<strong>in</strong>eties has followedvery diverse patterns, rang<strong>in</strong>g from acceleratedprogress <strong>in</strong> some fields to slowdown<strong>and</strong> even regression <strong>in</strong> other respects.The po<strong>in</strong>t is illustrated <strong>in</strong> Figure 7,where simple measures of the progress ofdifferent social <strong>in</strong>dicators <strong>in</strong> the n<strong>in</strong>etiesare compared with the correspond<strong>in</strong>gachievements <strong>in</strong> the eighties.Elementary education provides an <strong>in</strong>terest<strong>in</strong>gexample of accelerated progress <strong>in</strong>the n<strong>in</strong>eties. 46 This trend is evident notonly from census data on literacy rates, butalso from National Family Health Surveydata on school participation. To illustrate,school participation among girls aged 6-14jumped from 59 per cent to 74 per centbetween 1992-93 <strong>and</strong> 1998-99. 47 The regionalpatterns are also <strong>in</strong>structive. It isparticularly <strong>in</strong>terest<strong>in</strong>g to note evidence ofrapid progress <strong>in</strong> Madhya Pradesh <strong>and</strong>Rajasthan, demarcat<strong>in</strong>g them clearly fromBihar <strong>and</strong> Uttar Pradesh, the other twomembers of the so-called BIMARU set. 48There is an important po<strong>in</strong>ter here to therelation between public action <strong>and</strong> socialachievements. Indeed, Madhya PradeshEconomic <strong>and</strong> Political Weekly September 7, 2002 3743