

Poverty and Inequality in India: a Reexamination - Princeton University
Poverty and Inequality in India: a Reexamination - Princeton University
Poverty and Inequality in India: a Reexamination - Princeton University

Create successful ePaper yourself
Turn your PDF publications into a flip-book with our unique Google optimized e-Paper software.
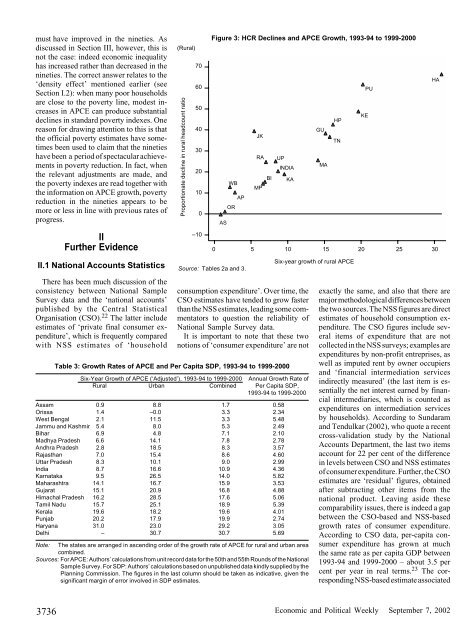
must have improved <strong>in</strong> the n<strong>in</strong>eties. Asdiscussed <strong>in</strong> Section III, however, this isnot the case: <strong>in</strong>deed economic <strong>in</strong>equalityhas <strong>in</strong>creased rather than decreased <strong>in</strong> then<strong>in</strong>eties. The correct answer relates to the‘density effect’ mentioned earlier (seeSection I.2): when many poor householdsare close to the poverty l<strong>in</strong>e, modest <strong>in</strong>creases<strong>in</strong> APCE can produce substantialdecl<strong>in</strong>es <strong>in</strong> st<strong>and</strong>ard poverty <strong>in</strong>dexes. Onereason for draw<strong>in</strong>g attention to this is thatthe official poverty estimates have sometimesbeen used to claim that the n<strong>in</strong>etieshave been a period of spectacular achievements<strong>in</strong> poverty reduction. In fact, whenthe relevant adjustments are made, <strong>and</strong>the poverty <strong>in</strong>dexes are read together withthe <strong>in</strong>formation on APCE growth, povertyreduction <strong>in</strong> the n<strong>in</strong>eties appears to bemore or less <strong>in</strong> l<strong>in</strong>e with previous rates ofprogress.IIFurther EvidenceII.1 National Accounts StatisticsThere has been much discussion of theconsistency between National SampleSurvey data <strong>and</strong> the ‘national accounts’published by the Central StatisticalOrganisation (CSO). 22 The latter <strong>in</strong>cludeestimates of ‘private f<strong>in</strong>al consumer expenditure’,which is frequently comparedwith NSS estimates of ‘household(Rural)consumption expenditure’. Over time, theCSO estimates have tended to grow fasterthan the NSS estimates, lead<strong>in</strong>g some commentatorsto question the reliability ofNational Sample Survey data.It is important to note that these twonotions of ‘consumer expenditure’ are notTable 3: Growth Rates of APCE <strong>and</strong> Per Capita SDP, 1993-94 to 1999-2000Six-Year Growth of APCE (‘Adjusted’), 1993-94 to 1999-2000 Annual Growth Rate ofRural Urban Comb<strong>in</strong>ed Per Capita SDP,1993-94 to 1999-2000Assam 0.9 8.8 1.7 0.58Orissa 1.4 –0.0 3.3 2.34West Bengal 2.1 11.5 3.3 5.48Jammu <strong>and</strong> Kashmir 5.4 8.0 5.3 2.49Bihar 6.9 4.8 7.1 2.10Madhya Pradesh 6.6 14.1 7.8 2.78Andhra Pradesh 2.8 18.5 8.3 3.57Rajasthan 7.0 15.4 8.6 4.60Uttar Pradesh 8.3 10.1 9.0 2.99<strong>India</strong> 8.7 16.6 10.9 4.36Karnataka 9.5 26.5 14.0 5.82Maharashtra 14.1 16.7 15.9 3.53Gujarat 15.1 20.9 16.8 4.88Himachal Pradesh 16.2 28.5 17.6 5.06Tamil Nadu 15.7 25.1 18.9 5.39Kerala 19.6 18.2 19.6 4.01Punjab 20.2 17.9 19.9 2.74Haryana 31.0 23.0 29.2 3.05Delhi – 30.7 30.7 5.69Note: The states are arranged <strong>in</strong> ascend<strong>in</strong>g order of the growth rate of APCE for rural <strong>and</strong> urban areacomb<strong>in</strong>ed.Sources: For APCE: Authors’ calculations from unit record data for the 50th <strong>and</strong> 55th Rounds of the NationalSample Survey. For SDP: Authors’ calculations based on unpublished data k<strong>in</strong>dly supplied by thePlann<strong>in</strong>g Commission. The figures <strong>in</strong> the last column should be taken as <strong>in</strong>dicative, given thesignificant marg<strong>in</strong> of error <strong>in</strong>volved <strong>in</strong> SDP estimates.Proportionate decl<strong>in</strong>e <strong>in</strong> rural headcount ratio706050403020100–10Figure 3: HCR Decl<strong>in</strong>es <strong>and</strong> APCE Growth, 1993-94 to 1999-2000ASWBORAP0 5 10 15 20 25 30Source: Tables 2a <strong>and</strong> 3.JKRA UPINDIABI KAMPGUMAHPTNSix-year growth of rural APCEKEPUHAexactly the same, <strong>and</strong> also that there aremajor methodological differences betweenthe two sources. The NSS figures are directestimates of household consumption expenditure.The CSO figures <strong>in</strong>clude severalitems of expenditure that are notcollected <strong>in</strong> the NSS surveys; examples areexpenditures by non-profit entreprises, aswell as imputed rent by owner occupiers<strong>and</strong> ‘f<strong>in</strong>ancial <strong>in</strong>termediation services<strong>in</strong>directly measured’ (the last item is essentiallythe net <strong>in</strong>terest earned by f<strong>in</strong>ancial<strong>in</strong>termediaries, which is counted asexpenditures on <strong>in</strong>termediation servicesby households). Accord<strong>in</strong>g to Sundaram<strong>and</strong> Tendulkar (2002), who quote a recentcross-validation study by the NationalAccounts Department, the last two itemsaccount for 22 per cent of the difference<strong>in</strong> levels between CSO <strong>and</strong> NSS estimatesof consumer expenditure. Further, the CSOestimates are ‘residual’ figures, obta<strong>in</strong>edafter subtract<strong>in</strong>g other items from thenational product. Leav<strong>in</strong>g aside thesecomparability issues, there is <strong>in</strong>deed a gapbetween the CSO-based <strong>and</strong> NSS-basedgrowth rates of consumer expenditure.Accord<strong>in</strong>g to CSO data, per-capita consumerexpenditure has grown at muchthe same rate as per capita GDP between1993-94 <strong>and</strong> 1999-2000 – about 3.5 percent per year <strong>in</strong> real terms. 23 The correspond<strong>in</strong>gNSS-based estimate associated3736Economic <strong>and</strong> Political Weekly September 7, 2002


