
Create successful ePaper yourself
Turn your PDF publications into a flip-book with our unique Google optimized e-Paper software.
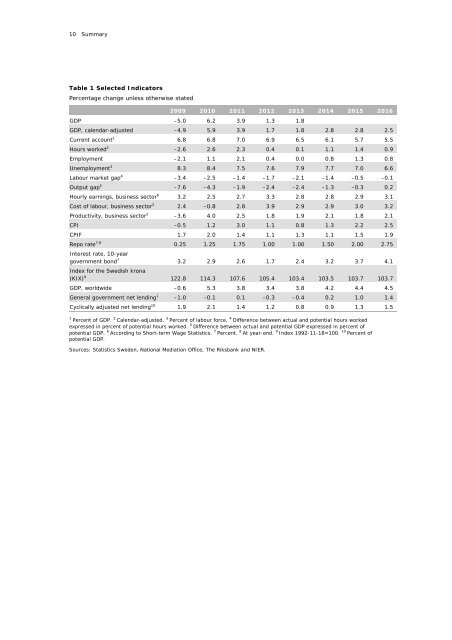
10 SummaryTable 1 Selected IndicatorsPercentage change unless otherwise stated2009 2010 2011 <strong>2012</strong> 2013 2014 2015 2016GDP –5.0 6.2 3.9 1.3 1.8GDP, calendar-adjusted –4.9 5.9 3.9 1.7 1.8 2.8 2.8 2.5Current account 1 6.8 6.8 7.0 6.9 6.5 6.1 5.7 5.5Hours worked 2 –2.6 2.6 2.3 0.4 0.1 1.1 1.4 0.9Employment –2.1 1.1 2.1 0.4 0.0 0.8 1.3 0.8Unemployment 3 8.3 8.4 7.5 7.6 7.9 7.7 7.0 6.6Labour market gap 4 –3.4 –2.5 –1.4 –1.7 –2.1 –1.4 –0.5 –0.1Output gap 5 –7.6 –4.3 –1.9 –2.4 –2.4 –1.3 –0.3 0.2Hourly earnings, business sector 6 3.2 2.5 2.7 3.3 2.8 2.8 2.9 3.1Cost of labour, business sector 2 2.4 –0.8 2.8 3.9 2.9 2.9 3.0 3.2Productivity, business sector 2 –3.6 4.0 2.5 1.8 1.9 2.1 1.8 2.1CPI –0.5 1.2 3.0 1.1 0.8 1.3 2.2 2.5CPIF 1.7 2.0 1.4 1.1 1.3 1.1 1.5 1.9Repo rate 7,8 0.25 1.25 1.75 1.00 1.00 1.50 2.00 2.75Interest rate, 10-yeargovernment bond 7 3.2 2.9 2.6 1.7 2.4 3.2 3.7 4.1Index for the <strong>Swedish</strong> krona(KIX) 9 122.8 114.3 107.6 105.4 103.4 103.5 103.7 103.7GDP, worldwide –0.6 5.3 3.8 3.4 3.8 4.2 4.4 4.5General government net lending 1 –1.0 –0.1 0.1 –0.3 –0.4 0.2 1.0 1.4Cyclically adjusted net lending 10 1.9 2.1 1.4 1.2 0.8 0.9 1.3 1.51Percent of GDP. 2 Calendar-adjusted. 3 Percent of labour force. 4 Difference between actual and potential hours workedexpressed in percent of potential hours worked. 5 Difference between actual and potential GDP expressed in percent ofpotential GDP. 6 According to Short-term Wage Statistics. 7 Percent. 8 At year-end. 9 Index 1992-11-18=100. 10 Percent ofpotential GDP.Sources: Statistics Sweden, National Mediation Office, <strong>The</strong> Riksbank and NIER.