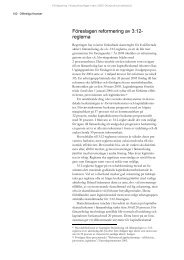
14 SummaryDiagram 17 Cyclically Adjusted NetLendingPercent of potential GDP3210-1-2-300020406081012NIER´s forecast, <strong>August</strong> <strong>2012</strong>More expansionary fiscal policy 201314163210-1-2-3net lending decreases to 0.5 percent of potential GDP in 2013.<strong>The</strong>reafter it will gradually rise, in these calculations, to1.5 percent of potential GDP in 2016, the same level as in theforecast (see Diagram 17).<strong>The</strong> Government, however, is much more optimistic thanthe NIER about the future development of GDP and unemployment.In the Government’s forecast, unemployment dropsto 5.2 percent in 2016, almost 1.5 percentage points lower thanin the NIER’s forecast (see Diagram 18). Employment is higher,and GDP is growing faster. In the Government’s forecast thelevel of GDP is 2.9 percent higher in 2016 than in the NIER’sforecast (see Diagram 19). This means that their assessment offuture tax revenue and expenditure for unemployment is moreoptimistic, thus creating a margin for unfunded measures.Sources: Statistics Sweden, Government andNIER.Diagram 18 UnemploymentPercent of labour force8.58.07.57.06.56.05.55.0000204060810NIER´s forecast, <strong>August</strong> <strong>2012</strong>Government forecastSources: Statistics Sweden, Government andNIER.Diagram 19 GDPIndex 2011=100, calendar-adjusted level120110100908070000204060810NIER´s forecast, <strong>August</strong> <strong>2012</strong>Government forecastSources: Statistics Sweden, Government andNIER.1212141416168.58.07.57.06.56.05.55.0120110100908070EARLIER IMPLEMENTATION OF MEASURES WILL HELPSPEED UP ECONOMIC RECOVERY SOMEWHAT<strong>The</strong> NIER has prepared a general calculation of how the overallmacroeconomic development would be affected by 9 billion morein unfunded measures in 2013 and SEK 9 billion less in unfundedmeasures in 2014–2015. It is assumed in the calculationsthat the emphasis in these additional measures will be on reducingtaxes for firms and on infrastructure investment and maintenance.<strong>The</strong> overall effect of the more expansionary fiscal policy isthat GDP growth will be a few tenths of a percentage pointhigher in 2013 and slightly lower in 2014–2015. Unemploymentwill decrease somewhat sooner, but the levels of GDP and employmentin 2016 are largely identical with the forecast. 6 Asthere will not be time to influence inflation significantly, theRiksbank will not change interest rates more than marginally.In this assessment, no consideration has been given to possibleeffects that would permanently increase employment or capitalformation. This is due partly to the lack of sufficiently welldevelopedproposals to consider, and partly to the likelihoodthat the effects would probably be minor in 2013–2016.From a cyclical standpoint it would be desirable to implementunfunded measures in 2013, when the economy is slack.This would help to speed up recovery and counteract the rise inlong-term unemployment. However, since the margin for permanentunfunded measures is limited, in the NIER’s opinion, italso means that fiscal policy must be given a contractionarystance in 2014–2016 in order to achieve the surplus target forgeneral government finances.6 <strong>The</strong> Government’s higher forecast for the level of GDP in 2016 is explainableprimarily by a more optimistic assessment of structural unemployment. Thisassessment does not seemed to have been affected appreciably by the newmeasures.
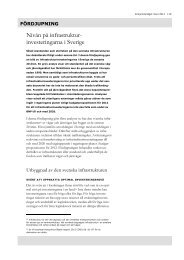
15Macroeconomic Development andEconomic Policy <strong>2012</strong>–2016<strong>The</strong> recession is deepening this year, and the <strong>Swedish</strong> economywill not begin to recover until the second quarter of 2013. Economicpolicy will need to remain expansionary in order to stimulatedomestic demand as exports stagnate because of the lacklustretendency of demand and a stronger krona. Fiscal policywill be slightly expansionary this year and next year, but contractionaryin 2014–2016 so that net lending will reach1.5 percent of GDP when resource utilization in the economy isbalanced is achieved in 2016. <strong>The</strong> repo rate will be lowered to1 percent this year and will need to be kept low for several yearsahead.This chapter first presents the NIER’s forecast for the developmentof the international and <strong>Swedish</strong> economy during <strong>2012</strong>–2016. <strong>The</strong>re is then a more detailed description of the developmentof monetary and fiscal policies. A detailed presentation ofthe forecast for the short term, <strong>2012</strong>–2013, is found in the fivechapters immediately thereafter.International DevelopmentsAFTER-EFFECTS OF THE FINANCIAL CRISIS TO PERSIST<strong>The</strong> after-effects of the rapid build-up of private debt during theyears preceding the financial crisis will continue to impact theworld economy for several years to come. GDP growth andresource utilization in the OECD countries will admittedly berising for the next few years, but growth will be limited comparedto previous recoveries. <strong>The</strong> level of GDP in the OECDcountries in 2016 is forecast to be more than 10 percent lowerthan if GDP growth had been in line with the trend for 1998–2007 (see Diagram 20).Before the crisis, it was often emphasized that imbalances innet lending between countries, as reflected in the current accounts,were a threat to the stability of the world economy. Surplusesor deficits in the current accounts of different countriesare not a problem in themselves, but may be an indication that ahigh level of net lending in countries, due to demographic factors,for example, is being channelled into countries where thereturn on investment is higher. If countries with deficits importcapital for investments that will raise the long-term level ofGDP, this will in time contribute to higher global growth. In theyears before the financial crisis, however, net lending was channelledprimarily into developed countries, where housing investmentand private debt, for example, rapidly increased.Diagram 20 GDP in OECD CountriesIndex 2007=10013012011010090807098000204060810GDPProjection of trend 1998-2007Sources: OECD and NIER.121416130120110100908070