
You also want an ePaper? Increase the reach of your titles
YUMPU automatically turns print PDFs into web optimized ePapers that Google loves.
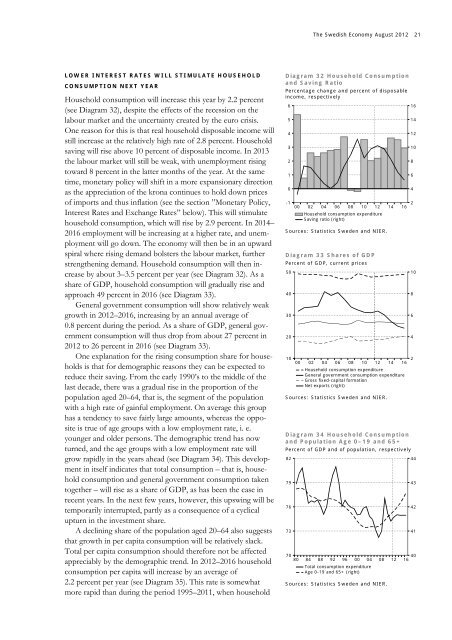
<strong>The</strong> <strong>Swedish</strong> <strong>Economy</strong> <strong>August</strong> <strong>2012</strong> 21LOWER INTEREST RATES WILL STIMULATE HOUSEHOLDCONSUMPTION NEXT YEARHousehold consumption will increase this year by 2.2 percent(see Diagram 32), despite the effects of the recession on thelabour market and the uncertainty created by the euro crisis.One reason for this is that real household disposable income willstill increase at the relatively high rate of 2.8 percent. Householdsaving will rise above 10 percent of disposable income. In 2013the labour market will still be weak, with unemployment risingtoward 8 percent in the latter months of the year. At the sametime, monetary policy will shift in a more expansionary directionas the appreciation of the krona continues to hold down pricesof imports and thus inflation (see the section ”Monetary Policy,Interest Rates and Exchange Rates” below). This will stimulatehousehold consumption, which will rise by 2.9 percent. In 2014–2016 employment will be increasing at a higher rate, and unemploymentwill go down. <strong>The</strong> economy will then be in an upwardspiral where rising demand bolsters the labour market, furtherstrengthening demand. Household consumption will then increaseby about 3–3.5 percent per year (see Diagram 32). As ashare of GDP, household consumption will gradually rise andapproach 49 percent in 2016 (see Diagram 33).General government consumption will show relatively weakgrowth in <strong>2012</strong>–2016, increasing by an annual average of0.8 percent during the period. As a share of GDP, general governmentconsumption will thus drop from about 27 percent in<strong>2012</strong> to 26 percent in 2016 (see Diagram 33).One explanation for the rising consumption share for householdsis that for demographic reasons they can be expected toreduce their saving. From the early 1990’s to the middle of thelast decade, there was a gradual rise in the proportion of thepopulation aged 20–64, that is, the segment of the populationwith a high rate of gainful employment. On average this grouphas a tendency to save fairly large amounts, whereas the oppositeis true of age groups with a low employment rate, i. e.younger and older persons. <strong>The</strong> demographic trend has nowturned, and the age groups with a low employment rate willgrow rapidly in the years ahead (see Diagram 34). This developmentin itself indicates that total consumption – that is, householdconsumption and general government consumption takentogether – will rise as a share of GDP, as has been the case inrecent years. In the next few years, however, this upswing will betemporarily interrupted, partly as a consequence of a cyclicalupturn in the investment share.A declining share of the population aged 20–64 also suggeststhat growth in per capita consumption will be relatively slack.Total per capita consumption should therefore not be affectedappreciably by the demographic trend. In <strong>2012</strong>–2016 householdconsumption per capita will increase by an average of2.2 percent per year (see Diagram 35). This rate is somewhatmore rapid than during the period 1995–2011, when householdDiagram 32 Household Consumptionand Saving RatioPercentage change and percent of disposableincome, respectively6543210-100020406081012Household consumption expenditureSaving ratio (right)Sources: Statistics Sweden and NIER.Diagram 33 Shares of GDPPercent of GDP, current prices5040302010000204060810121414Household consumption expenditureGeneral government consumption expenditureGross fixed-capital formationNet exports (right)Sources: Statistics Sweden and NIER.Diagram 34 Household Consumptionand Population Age 0–19 and 65+Percent of GDP and of population, respectively827976737080848892960004Total consumption expenditureAge 0-19 and 65+ (right)08Sources: Statistics Sweden and NIER.121616161412108642108642444342414016