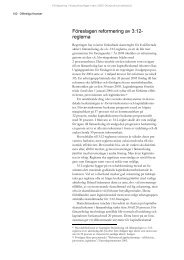
16 Macroeconomic Development and Economic Policy <strong>2012</strong>–2016Diagram 21 Current AccountPercent of GDP151050-5-10-15959799ChinaUSGermanySpainSweden01Sources: Statistics Sweden, IMF and NIER.03Diagram 22 GDP Components in SpainIndex 2007=1001201101009080706050000204Domestic demandImportsExports06Sources: Eurostat and NIER.Diagram 23 Real Government BondInterest RatesPercent, monthly values543210-1-200UKUS0204Note: 10-year maturity.0605Sources: Macrobond and NIER.08080709101011151050-5-10-151201101009080706050543210-1-2<strong>The</strong> imbalances have decreased substantially compared to theperiod before the financial crisis (see Diagram 21). But the adjustmenttoward smaller imbalances in net lending betweencountries has not taken place via the contribution of investmentto higher long-term GDP growth and exports in the countrieswith deficits. Rather, the adjustment has been made through aweak economic tendency in the countries which prior to thefinancial crisis had substantial deficits in their current accountsand a rapid accumulation of debt. In these countries, such asSpain, the UK and the United States, the deficits have decreasedas domestic demand and thus imports have shown a muchweaker tendency than exports (in Diagram 22 the tendency inSpain is shown). At the same time, unemployment has risen. <strong>The</strong>improvement in the so-called external balance (the current account)has thus taken place at the price of a higher internal imbalance,in the form of unemployment, for example. With aprolonged period of high unemployment in a country, there is adanger that employment will drop to a permanently lower level.<strong>The</strong> balance in the current account of the surplus countrieshas diminished, particularly in China, but this tendency is duemore to lower exports than to stronger domestic demand. At theglobal level, the tendency thus means that the propensity forsaving and net lending has risen, while at the same time investmenthas been depressed after the financial crisis. This has contributedto the pressure that has pushed real rates of interestdown to record-low levels (see Diagram 23).With a few exceptions, productivity, measured as output perhour worked in the business sector, has not recovered from itsdecline after the financial crisis in the OECD countries. <strong>The</strong>development of productivity has thus been considerably weakerthat the annual growth of nearly 2 percent observed in 2000–2007. <strong>The</strong> lacklustre tendency of investment and world trademay be contributing causes, but they hardly explain the entiredecrease in productivity growth.<strong>The</strong> weakness of productivity, in combination with a lacklustreeconomy and structural problems on the labour market inmany countries, mean that the level of GDP has shown muchweaker growth since 2008 than could have been expected (seeDiagram 20). This raises questions about the sustainable rate oflong-term growth in the OECD countries. If this rate remainslower for an extended period, further challenges will be posed inregard, for example, to the sustainability of public finances. Inthe NIER’s medium-range forecasts, it is assumed that potentialproductivity growth will gradually return to historical rates,which means that the losses incurred in recent years will not berecouped. In many areas, the tendency of potential GDP issomewhat weaker than it has been historically since the age profileof the population means slower growth in the labour force.<strong>The</strong> unexpectedly low level of GDP is one reason why governmentdebt, in terms of both level and share of GDP, hasrisen rapidly in recent years. A lower level of GDP also means
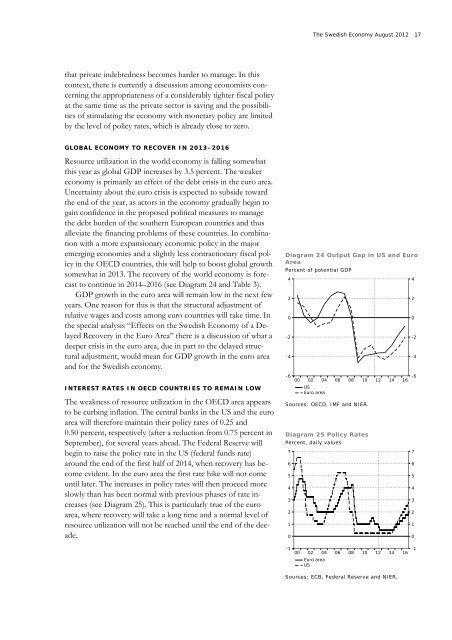
<strong>The</strong> <strong>Swedish</strong> <strong>Economy</strong> <strong>August</strong> <strong>2012</strong> 17that private indebtedness becomes harder to manage. In thiscontext, there is currently a discussion among economists concerningthe appropriateness of a considerably tighter fiscal policyat the same time as the private sector is saving and the possibilitiesof stimulating the economy with monetary policy are limitedby the level of policy rates, which is already close to zero.GLOBAL ECONOMY TO RECOVER IN 2013–2016Resource utilization in the world economy is falling somewhatthis year as global GDP increases by 3.5 percent. <strong>The</strong> weakereconomy is primarily an effect of the debt crisis in the euro area.Uncertainty about the euro crisis is expected to subside towardthe end of the year, as actors in the economy gradually begin togain confidence in the proposed political measures to managethe debt burden of the southern European countries and thusalleviate the financing problems of these countries. In combinationwith a more expansionary economic policy in the majoremerging economies and a slightly less contractionary fiscal policyin the OECD countries, this will help to boost global growthsomewhat in 2013. <strong>The</strong> recovery of the world economy is forecastto continue in 2014–2016 (see Diagram 24 and Table 3).GDP growth in the euro area will remain low in the next fewyears. One reason for this is that the structural adjustment ofrelative wages and costs among euro countries will take time. Inthe special analysis “Effects on the <strong>Swedish</strong> <strong>Economy</strong> of a DelayedRecovery in the Euro Area” there is a discussion of what adeeper crisis in the euro area, due in part to the delayed structuraladjustment, would mean for GDP growth in the euro areaand for the <strong>Swedish</strong> economy.INTEREST RATES IN OECD COUNTRIES TO REMAIN LOW<strong>The</strong> weakness of resource utilization in the OECD area appearsto be curbing inflation. <strong>The</strong> central banks in the US and the euroarea will therefore maintain their policy rates of 0.25 and0.50 percent, respectively (after a reduction from 0.75 percent inSeptember), for several years ahead. <strong>The</strong> Federal Reserve willbegin to raise the policy rate in the US (federal funds rate)around the end of the first half of 2014, when recovery has becomeevident. In the euro area the first rate hike will not comeuntil later. <strong>The</strong> increases in policy rates will then proceed moreslowly than has been normal with previous phases of rate increases(see Diagram 25). This is particularly true of the euroarea, where recovery will take a long time and a normal level ofresource utilization will not be reached until the end of the decade.Diagram 24 Output Gap in US and EuroAreaPercent of potential GDP420-2-4-6000204USEuro area060810Sources: OECD, IMF and NIER.Diagram 25 Policy RatesPercent, daily values76543210121416420-2-4-676543210-100 02 04Euro areaUS060810121416-1Sources: ECB, Federal Reserve and NIER.