
Create successful ePaper yourself
Turn your PDF publications into a flip-book with our unique Google optimized e-Paper software.
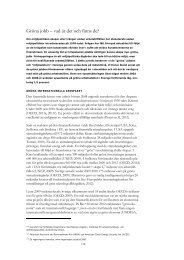
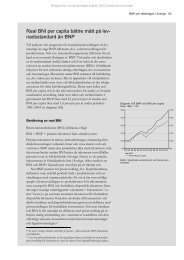
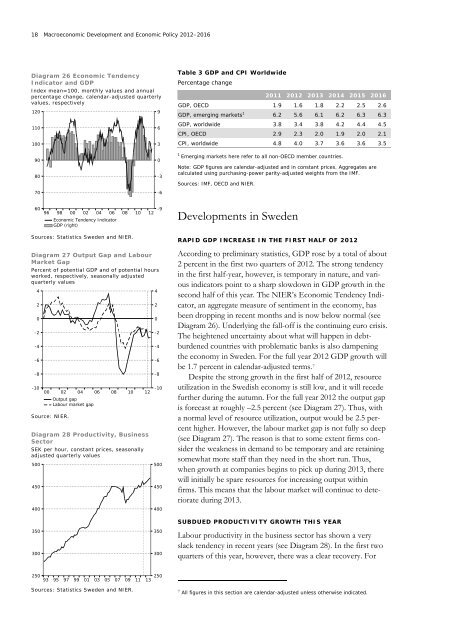
18 Macroeconomic Development and Economic Policy <strong>2012</strong>–2016Diagram 26 Economic TendencyIndicator and GDPIndex mean=100, monthly values and annualpercentage change, calendar-adjusted quarterlyvalues, respectively120110100963Table 3 GDP and CPI WorldwidePercentage change2011 <strong>2012</strong> 2013 2014 2015 2016GDP, OECD 1.9 1.6 1.8 2.2 2.5 2.6GDP, emerging markets 1 6.2 5.6 6.1 6.2 6.3 6.3GDP, worldwide 3.8 3.4 3.8 4.2 4.4 4.5CPI, OECD 2.9 2.3 2.0 1.9 2.0 2.1CPI, worldwide 4.8 4.0 3.7 3.6 3.6 3.590800-31Emerging markets here refer to all non-OECD member countries.Note: GDP figures are calendar-adjusted and in constant prices. Aggregates arecalculated using purchasing-power parity-adjusted weights from the IMF.Sources: IMF, OECD and NIER.70-660969800020406Economic Tendency IndicatorGDP (right)081012-9Developments in SwedenSources: Statistics Sweden and NIER.Diagram 27 Output Gap and LabourMarket GapPercent of potential GDP and of potential hoursworked, respectively, seasonally adjustedquarterly values420-2-4-6-8-100002Source: NIER.04Output gapLabour market gapDiagram 28 Productivity, BusinessSectorSEK per hour, constant prices, seasonallyadjusted quarterly values50045040006081012420-2-4-6-8-10500450400RAPID GDP INCREASE IN THE FIRST HALF OF <strong>2012</strong>According to preliminary statistics, GDP rose by a total of about2 percent in the first two quarters of <strong>2012</strong>. <strong>The</strong> strong tendencyin the first half-year, however, is temporary in nature, and variousindicators point to a sharp slowdown in GDP growth in thesecond half of this year. <strong>The</strong> NIER’s Economic Tendency Indicator,an aggregate measure of sentiment in the economy, hasbeen dropping in recent months and is now below normal (seeDiagram 26). Underlying the fall-off is the continuing euro crisis.<strong>The</strong> heightened uncertainty about what will happen in debtburdenedcountries with problematic banks is also dampeningthe economy in Sweden. For the full year <strong>2012</strong> GDP growth willbe 1.7 percent in calendar-adjusted terms. 7Despite the strong growth in the first half of <strong>2012</strong>, resourceutilization in the <strong>Swedish</strong> economy is still low, and it will recedefurther during the autumn. For the full year <strong>2012</strong> the output gapis forecast at roughly –2.5 percent (see Diagram 27). Thus, witha normal level of resource utilization, output would be 2.5 percenthigher. However, the labour market gap is not fully so deep(see Diagram 27). <strong>The</strong> reason is that to some extent firms considerthe weakness in demand to be temporary and are retainingsomewhat more staff than they need in the short run. Thus,when growth at companies begins to pick up during 2013, therewill initially be spare resources for increasing output withinfirms. This means that the labour market will continue to deteriorateduring 2013.350300350300SUBDUED PRODUCTIVITY GROWTH THIS YEARLabour productivity in the business sector has shown a veryslack tendency in recent years (see Diagram 28). In the first twoquarters of this year, however, there was a clear recovery. For2509395979901030507091125013Sources: Statistics Sweden and NIER.7 All figures in this section are calendar-adjusted unless otherwise indicated.