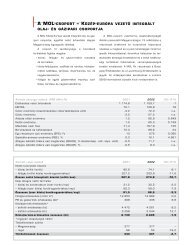
Indicator Unit 2006 2007 2008 2009*2010withoutINAChange2009-2010 (%)2010<strong>MOL</strong>Group**GRIcodeHealth and SafetyLost Time Injury (LTI) pcs 58.0 37.0 24.0 28.0 40.0 43% 104.00 LA7Lost Time InjuryFrequency (LTIF)2.20 1.52 0.99 1.13 1.50 33% 2.25 LA7Total <strong>Report</strong>ableOccupational Illnesses0.00 0.00 0.04 0.00 0.00 0% 0.00 LA7Frequency (TROIF)Lost day rate (LDR) % n.a. n.a. n.a. 0.05 0.05 0% 0.27 LA7Absentee Rate (AR) % n.a. n.a. 2.65 2.17 2.08 -4% 2.97 LA7Number of fatalitiesfor emloyeespcs 0 0 0 1 1 0% 1 LA7Number of fatalitiesfor contractorspcs 1 0 2 1 2 100% 2 LA7Number of fatalitiesfor 3rd partiespcs 1 2 2 0 0 0% 1 LA7Number of fires pcs 19 9 14 12 23 92% 29Fire damagemnHUF387.2 26.7 49.4 55.8 863.6 1448% 975.4EmployeesTotal workforce pple 13,861 15,058 17,338 17,963 17,882 -0.5% 32,601 LA1Number ofpart-time employeespple n.a. 92 125 114 143 25% 191 LA1Leavers pple 707 1,540 1,136 988 1,480 50% 3,243 LA2Employee turnover rate % 5.1 10.2 6.6 5.5 8.3 51% 9.9 LA2Employees representedby trade unions% 97.3 85.5 93.3 91.4 92.8 2% 94.5 LA4Employees coveredby collectivebargaining agreementDiversityRatio of womenin total workforce% n.a. n.a. 94.5 93.4 92.7 -1% 94.5 LA4% 26.0 24.6 24.8 22.6 22.7 0.4% 23.1 LA13SustainabilityRatio of women innon-managerialposition% n.a. n.a. 25.1 22.9 22.9 0.1% 23.3 LA13Ratio of women inmanagerial position% 14.1 18.5 19.4 12.3 14.6 18.7% 18.2 LA13Other SocialEthical notifications pcs n.a. 3 13 8 10 25% 11Ethical investigations pcs n.a. 0 7 6 7 17% 7Ethical misconducts pcs n.a. 0 1 4 4 0% 4Average hours oftraining per employeehours n.a. n.a. n.a. 21 25 19% 18 LA10DonationsmnHUF665.1 540.2 752.0 1,116.2 1,834.8 64% 1,861.1 EC8In-kind giving(products and services)mnHUFn.a. n.a. n.a. 23.1 42.5 84% 47.1 EC8Corporate volunteering hours n.a. n.a. n.a. 3,508.0 2,143.5 -39% 2,303.5 EC8We indicate with ’n.a.’ where we have no data available.Exchange rate based on Y2010 average, 1 HRK=37.79 HUF*Total <strong>MOL</strong> Group without INA Group**Total <strong>MOL</strong> Group 2010 including INA d.d. (without its subsidiaries), except Employee data (LA1, LA2) which covers total <strong>MOL</strong> GroupSummer Party – Lake Balaton in Hungary202 <strong>MOL</strong> Group annual report 2010 203
5 Notes on Non-Financial <strong>Report</strong>ing5.1 Our reporting approachAs a demonstration of <strong>MOL</strong>’s resolve to integrate a sustainability approach into everyday business operations, managementdecided to merge our <strong>Annual</strong> and Sustainable Development <strong>Report</strong>s and move towards an ’integrated’ reporting approachin 2008. Consequently, the company now follows the Triple Bottom Line approach; presenting the economic, social andenvironmental performance of <strong>MOL</strong> Group in one comprehensive report.The ’Sustainability: non-financial performance’ section of the <strong>Annual</strong> <strong>Report</strong> contains information on the key achievements,challenges and data of the given year about the most relevant topics for <strong>MOL</strong> in the area of sustainability. Beyond this report,one will find a general presentation of <strong>MOL</strong>’s policies, management approaches and other regularly maintained and updatedSD-related information at www.mol.hu/sd. While the <strong>Annual</strong> <strong>Report</strong>’s main audience is assumed to be our shareholders,investors and sustainability analysts, our webpage is tailored to answering the information needs of all stakeholders.The sustainability performance data contained within this report was reviewed by Ernst and Young (please see the assurancestatement for the specific scope) and the assurance process was planned and performed in accordance with the InternationalFederation of Accountants’ ISAE3000 standard.This <strong>Annual</strong> <strong>Report</strong>, together with <strong>MOL</strong>’s website, meets the requirements of the A+ rating of the GRI G3 SustainabilityGuidelines in accordance to the GRI (see the assurance statement on p. 208.)The GRI Compliance Table can be viewed at the following website: www.mol.hu/annualreport2010/sustainability/gri,while local reports are available on the websites of individual <strong>MOL</strong> Group companies: www.ina.hr/sd, www.slovnaft.sk/sd,www.tvk.hu/sd, www.molpakistan.pk/sd and www.iesitaliana.it/sd.5.2 <strong>Report</strong> Content and MaterialityAll of the topics that reflect <strong>MOL</strong>’s significant economic, environmental and social impacts, and which might have an impacton our stakeholders, are treated as material concerns. When determining these issues, we take into consideration GRI G3guidelines, recommendations by our industry’s professional association (IPIECA) and industry-specific evaluation criteriafrom sustainability analysts such as the SAM Group and Oekom. Moreover, issues related to governmental initiativesconnected to SD might also be judged to be significant, for example compliance with certain legislation. Priority is givento topics where our company has more substantial impacts and where <strong>MOL</strong> can make efforts to improve its performance.Issues relevant to local sites are managed and reported locally.<strong>MOL</strong> follows the GRI G3 reporting guidelines and has achieved an A+ rating. Since there is no available oil and gas sectorspecificsupplement, we strived to follow the IPIECA-API ’Oil and Gas Industry Guidance on Voluntary Sustainability<strong>Report</strong>ing’ to determine additional, industry-specific indicators. This <strong>Annual</strong> <strong>Report</strong>, in conjunction with the informationavailable on our website, comprises <strong>MOL</strong> Group’s sustainability reporting and thus complies with GRI requirements.5.4 GRI, Global Compact and IPIECA IndexGRI IndicatorGlobalCompactPrincipleIPIECAIndicatorSubjectStrategy and Profile1.1 Chief executive statement 176-1771.2 Description of key risks and opportunities 10-45, 224-2252.1–2.10 Organizational profile, structures, markets 4, 103.1, 3.3 <strong>Report</strong>ing period and cycle 1, 2043.4–3.13 <strong>Report</strong> scope, assurance 204, 208-2094.1–4.7 Corporate governance 214-2224.8–4.13 Guidelines and policies 92, 148, 196, 2044.14–4.17 SE1 Stakeholder engagementEconomic performance indicatorsManagement approach 1, 4, 6, 7 Detailed reference in GRI compliance table (web)EC1 SE4, SE13 Economic value generated and distributed 200EC2 7, 8, 9 Financial implications due to climate changeEC3 Coverage of benefit plan obligations 200EC4 Significant financial assistance from government 200EC5 Standard entry level wage/local minimum wage 189EC6 SE5, SE7 Locally-based suppliers at significant locations of operationEC7 6 SE5, SE6 Local hiringEC8 SE4 Investments for public benefit 197Environmental performance indicatorsManagement approach 7, 8, 9 Detailed reference in GRI compliance table (web)EN1–EN2 7, 8, 9 Materials usedEN3–EN7 7, 8, 9 E2, E3 Energy 181EN8–EN10 8, 9 E6 Water 183EN11-EN15 8 E5 Biodiversity 185EN16–EN20 7, 8, 9 E1, E4, E7 Emissions 182EN21 8 E9 Wastewater 183EN22 8 E10 Waste 184EN23 8 E8 Spills 185EN26 7, 8, 9 Products and services 45EN27 8, 9 HS4 Packaging materials reclaimed 184EN29, EN30 7, 8, 9 Environmental expenditures 201PageSustainability5.3 Scope and Boundary<strong>MOL</strong> applies the ‘control’ approach to consolidate information. The company accounts for 100 percent of the sustainabilitydata from operations over which it has control. This includes all companies/operations where <strong>MOL</strong> or one of its subsidiariesacts as operator.In the case of HSE data, we consider only operations which might have a significant impact on health, safety and theenvironment. Moreover, the <strong>MOL</strong> Group SD & HSE Department has been given 3 years to integrate any new acquisitions intoits reporting system. Therefore, HSE performance data does not necessarily contain the figures from operations acquired inthe last three years. Noteworthy changes compared to 2009 include IES and Tifon being accounted for in the 2010 data. It isplanned that the subsidiaries of INA d.d. will be integrated into the reporting only from 2012.Our human resources organisation uses an IT application called BI (Business Intelligence) Data Port to gather, among otherinformation, sustainability-related HR data from <strong>MOL</strong> Group companies. In 2010, the scope covered 29 companies includingINA d.d. Coverage for the entire <strong>MOL</strong> Group has reached 78%, or 91.5% excluding INA. Companies that do not exceed20 employees are not, and probably will not ever be integrated into this reporting process. Due to data supply problems,the following subsidiaries are largely excluded from the present report: <strong>MOL</strong> Romania, <strong>MOL</strong> Pakistan, <strong>MOL</strong>-Russ Ooo.,Greentrade Ltd., USI Ltd. and Tifon d.o.o. The absence of this data may have caused significant variations in the case ofcertain indicators. To see the full list of reporting companies see: www.mol.hu/annualreport2010/sustainability/subsidiaries204 <strong>MOL</strong> Group annual report 2010 205


