MOL GROUP Annual Report
MOL GROUP Annual Report
MOL GROUP Annual Report
- No tags were found...

You also want an ePaper? Increase the reach of your titles
YUMPU automatically turns print PDFs into web optimized ePapers that Google loves.
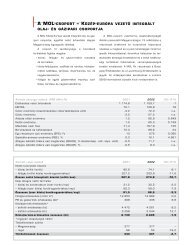
1.) We have audited the accompanying 2010 consolidated annual financial statements of <strong>MOL</strong> Hungarian Oil and Gas Plc. Keyfinancial data by business segmentsNET SALES REVENUES2009(HUF mn)2010(HUF mn)20092010(USD mn) 5 (USD mn) 5EBITDA EXC. SPEC ITEM 42009(HUF mn)2010(HUF mn)20092010(USD mn) 5 (USD mn) 5Exploration and Production 489,863 772,260 2,421 3,711Refining and Marketing 2,720,839 3,636,792 13,450 17,476Gas & Power 513,756 517,712 2,540 2,488Petrochemicals 388,280 524,205 1,919 2,519Corporate and other 164,678 164,486 814 790TOTAL NET SALES REVENUES 4,277,416 5,615,455 21,144 26,984NET EXTERNAL2009SALES REVENUES 1 (HUF mn)2010(HUF mn)20092010(USD mn) 5 (USD mn) 5Exploration and Production 301,788 518,406 1,491 2,491Refining and Marketing 2,396,450 3,160,919 11,846 15,189Gas & Power 236,166 190,638 1,168 916Petrochemicals 289,128 395,590 1,429 1,901Corporate and other 31,168 33,156 154 160TOTAL NET EXTERNAL SALES REVENUES 3,254,700 4,298,709 16,088 20,657OPERATING PROFIT2009(HUF mn)2010(HUF mn)20092010(USD mn) 5 (USD mn) 5Exploration and Production 136,722 206,857 676 994Refining and Marketing 15,474 31,808 76 153Gas & Power 61,902 67,666 306 325Petrochemicals (15,219) 1,098 (75) 5Corporate and other 28,000 (68,716) 138 (330)Inter-segment transfers 2 5,500 345 28 2TOTAL OPERATING PROFIT 232,379 239,058 1,149 1,149Exploration and Production 212,271 375,195 1,049 1,803Refining and Marketing 116,988 157,618 578 757Gas & Power 77,593 88,018 384 423Petrochemicals 3,089 19,247 15 92Corporate and other (29,139) (38,770) (144) (186)Inter-segment transfers 2 2,384 (3,109) 12 (14)TOTAL EBITDA EXC. SPEC ITEM 383,186 598,199 1,894 2,8751 Net external sales revenues and operating profit include the profit arising both from sales to third parties and transfers to the other business segments. Exploration and Production transfersdomestically produced crude oil, condensates and LPG to Refining and Marketing and natural gas to the Gas and Power segment. Refining and Marketing transfers chemical feedstock,propylene and isobutane to Petrochemicals and Petrochemicals transfers various by-products to Refining and Marketing. The internal transfer prices used are based on prevailing marketprices. Divisional figures contain the results of the fully consolidated subsidiaries engaged in the respective divisions.2 This line shows the change in the amount of unrealised operating profit in respect of transfers between segments. Unrealised profits arise when the item transferred is held as inventoryby the receiving segment at the end of the period and a third party sale takes place only in a subsequent period. For segmental reporting purposes the transferor segment records the profitimmediately at the point of transfer. However, at the company level profit is only recognised when the related third party sale has taken place. In previous years this unrealised profit effect wasnot shown separately, but was included in the reported segmental result of the receiving segment. Unrealised profits arise principally in respect of transfers from Exploration & Production toGas and Power and from Refining & Marketing to Petrochemicals.3 Operating profit excluding the additional expense of the turnover of inventories of INA which were recognized at fair market value upon initial consolidation as opposed to the carryingamounts reflected in INA Group’s separate financial statements (HUF 4.2 bn in Q1 2010), the additional mining royalty (HUF 30.4 bn at Exploration and Production division) paid in Q3 2010based on the decision of the EU Commission for which provision was recognised in Q2 2010, the provision for redundancy recorded at INA in Q3 2010 (HUF 15.5 bn, the majority of which hasbeen paid in Q4 2010), the provision for tax penalty recorded at INA in Q4 2010 (HUF 4.2 bn), the crisis tax imposed by the Hungarian state on domestic energy sector recorded in H2 2010(HUF 25.8 bn), the one-off gain on the subsequent settlement from E.ON and the Q2 2009 termination of the risk-sharing mechanism in connection with the sale of <strong>MOL</strong>’s gas business for Q1and Q2 2009 (HUF 14.0 bn and HUF 14.2 bn), the HUF 28.2 bn one-off non-cash revaluation gain, related to consolidating INA into <strong>MOL</strong> Group in 2009 for the first time as required by IFRS 3R,and the impact of impairment on the goodwill of IES and on certain exploration assets recognised in Q4 2009 and Q4 2010, respectively (HUF 4.7 bn and HUF 11.0 bn).4 EBITDA excluding the additional expense of turnover of the inventories of INA which were recognized at fair market values upon initial consolidation as opposed to the carrying amountsreflected in INA Group’s separate financial statements (HUF 4.2 bn in Q1 2010), the additional mining royalty (HUF 30.4 bn at Exploration and Production division) paid in Q3 2010 basedon the decision of the EU Commission for which provision was recognised in Q2 2010, the provision for redundancy recorded at INA in Q3 2010 (HUF 15.5 bn, the majority of which has beenpaid in Q4 2010), the provision for tax penalty recorded at INA in Q4 2010 (HUF 4.2 bn), the crisis tax imposed by the Hungarian state on domestic energy sector recorded in H2 2010 (HUF25.8 bn), the one-off gain on the subsequent settlement from E.ON and the Q2 2009 termination of the risk-sharing mechanism in connection with the sale of <strong>MOL</strong>’s gas business for Q1 andQ2 2009 (HUF 14.0 bn and HUF 14.2 bn), the HUF 28.2 bn one-off non-cash revaluation gain, related to consolidating INA into <strong>MOL</strong> Group in 2009 for the first time as required by IFRS 3R.5 In converting HUF financial data into USD, the following average NBH rates were used: for FY 2009: 202.3 HUF/USD, for FY 2010: 208.1 HUF/USD.Management Discussionand AnalysisOPERATING PROFITEXC. SPEC ITEM 32009(HUF mn)2010(HUF mn)20092010(USD mn) 5 (USD mn) 5Exploration and Production 144,735 258,572 715 1,243Refining and Marketing 28,150 58,518 139 281Gas & Power 61,902 68,119 306 327Petrochemicals (15,219) 1,400 (75) 7Corporate and other (44,366) (56,808) (219) (274)Inter-segment transfers 2 5,500 345 27 2TOTAL OPERATING PROFIT EXC. SPEC ITEM 180,702 330,146 893 1,586EBITDA2009(HUF mn)2010(HUF mn)20092010(USD mn) 5 (USD mn) 5Exploration and Production 204,258 334,496 1,010 1,607Refining and Marketing 108,968 130,908 539 629Gas & Power 77,593 87,565 384 421Petrochemicals 3,089 18,945 15 91Corporate and other 43,227 (50,678) 213 (243)Inter-segment transfers 2 2,384 (3,109) 12 (15)TOTAL EBITDA 439,519 518,127 2,173 2,49050 <strong>MOL</strong> Group annual report 2010 51