MOL GROUP Annual Report
MOL GROUP Annual Report
MOL GROUP Annual Report
- No tags were found...

Create successful ePaper yourself
Turn your PDF publications into a flip-book with our unique Google optimized e-Paper software.
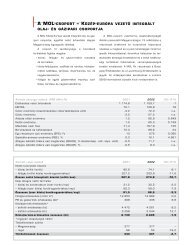
effluents. We found that the persistent organic content of effluents has a strong potential to accumulate and make thedischarged wastewater moderately ecotoxic. Our ecological impacts on the aquatic environment can be reduced byrecycling and reuse of the final effluents.At the Zala Refinery the capacity of the waste water treatment unit was improved by 100%, allowing us to reduce the CODof discharged water. In order to manage the COD level we connected our system to the public sewage system, so finalcleaning is carried out in the waste water treatment unit of the town.2.4 Waste management, spills and site remediationWaste managementIn 2010, the total amount of waste from <strong>MOL</strong> Group operations (without INA and IES) was approximately 157 thousandtons, the same as in 2008, but signalling an 18% increase compared to 2009. Due to our efforts the ratio of reused orrecycled waste has increased by 15% since 2008.Total weight of waste by type (t)2006 2007 2008 20092010(withoutINA)Change2008-2010(%)2010Total<strong>MOL</strong>GroupHazardous Waste 167,589 85,171 98,791 66,782 88,083 -10.8% 92,918Non-hazardous Waste n.a. n.a. 57,619 66,873 69,246 +20.2% 77,604Total n.a. n.a. 156,410 133,655 157,329 +0.6% 170,522The increase in waste production resulted from several turnarounds and other maintenance works which had beenpostponed from the previous year. For example, the disposal of a large amount of oily sludge accumulated in the DanubeRefinery’s waste water treatment plant led to 5,900 tons reported in additionally in the Refining Division. The quantity ofnon-hazardous waste increased by 9000 tons due to an obligation to clean the designated area for the construction of thenew CCGT Power Plant at the Danube Refinery.Total weight of waste by disposal method (t)2006 2007 2008 20092010(withoutINA)Change2008-2010(%)2010Total<strong>MOL</strong>GroupWaste Disposed / Landfilled 256,429 74,959 92,175 68,198 68,975 -25.2% 80,202Waste Reused / Recycled 55,016 86,180 64,235 65,456 88,355 +37.5% 90,320Total: 311,445 161,139 156,410 133,655 157,329 +0.6% 170,522Ratio of reused/recycledwaste (%):n.a. n.a. 41% 49% 56% 53%Examples of waste management actions:– Instituted waste reduction methods at the Rijeka Refinery in order to reduce the creation of oily sludge. Sludgewas treated utilising the decanter and centrifuge technique (partial reuse);– Treatment of 3000 tons of oil-based mud cuttings has been managed through bioremediation in Pakistan.Treated cuttings were later used in construction as fill material;– Launched the Green Office Programme at several sites and countries. Measures included digitalization ofdocuments, reduction of paper use (recycled paper use, 2-sided printing), installation of shared printers andrefilling toner cartridges.In our Lubricants Division, 19% (2009: 9.2%) of sold products were recollected and used as raw material for bitumenproduction in our refineries.SpillsIn 2010, there were 15 spills into the environment (over 1 m 3 ) by the <strong>MOL</strong> Group (excluding INA). Another 11 cases happenedat our Croatian operations. The majority of spills happened at Exploration and Production due to ruptures on mainly oilywater delivery pipelines. Some of the causes of the ruptures included the age of the pipelines, changed fluid compositionat oil fields, and intention of stealing the condensate from pipelines. In order to prevent further spills, Exploration andProduction has invested great effort to replace or repair critical pipeline corridors.Furthermore, due to pipeline sealing problems or other technological reasons, additional spills occurred at Refining andMarketing (10). The total volume of the spills amounted to 186 m 3 in 2010.After detecting the incidents, all necessary measures for aleviating the damage and its consequences were immediately putinto effect.Remediation<strong>MOL</strong> Group spent nearly HUF 3 billion for remediation of environmental damage in 2010. The share of responsibilty wasdivided among the Group as follows: <strong>MOL</strong> Plc. HUF 1.07 billion, Slovnaft HUF 1.45 billion, TVK HUF 0.12 billion and IES HUF0.2 billion. Remediation actions were also necessary in other countries, including Bosnia, though the order of magnitude waslower.Remediation tasks are managed at the group level, and are gradually being extended to the member companies. In INA, anassessment of provision-based environmental liabilities and the subsequent provisions (in line with the IFRS requirements)was completed in 2010. The primary goal of 2011 is the preparation of the future remediation programme and beginning theprocess of to eliminating environmental burdens.The majority of our remediation and monitoring tasks are naturally in Hungary and Slovakia, with the number of relatedlocations exceeding 250. Liabilities arise along the entire value chain. Besides the refineries, petrochemical and logistic sites,we also aim to improve the environmental status of various production facilities and filling stations. We have focused onmonitoring activities, since in this way we can receive feedback regarding the success of remediation and risk minimisationactions. In 2010, we completed remediation at seven locations, and closed the post-monitoring phase at twenty further sites.In 2010, with the support of the National Office of Research and Technology (NKTH), we continued our four-year (2009-2012) innovation programme in cooperation with TVK Plc. and external partners. The project titled ’Chemical Sector andLiveable Environment – Development of Innovative Technologies in the Protection of the Environment’ supports the analysisand validation of sustainability criteria in remediation activities, as well as operating technologies with minimal powerconsumption and low waste or no-waste production (contaminated water, soil, filters, etc.). Successful tests of innovativebarrier technologies were executed in the shallow and deep zones, which we aim to continue in 2011 as well.2.5 BiodiversityIn 2010, the Environmental Impact Identification (ENVID) methodology was extended to cover an initial biodiversityassessment and plan. We aim to conduct a pilot risk and impact assessment in 2011. This baseline biodiversity questionnairehas two objectives: first, to identify or confirm species, habitats, and ecosystems that are wholly or partly within the siteor project boundaries, along with their related functions and services; and secondly, to identify statutory designations andpriority species, habitats and ecosystems. Meeting these objectives we established the baseline for future monitoring ofimpacts and of the performance of the <strong>MOL</strong> Group Biodiversity Action Plan and Strategy (BAP) aligned to the existing HSEmanagement system and processes.In Exploration and Production Hungary, agreements with local national parks were signed to carry out biodiversity studiesfor our operations and to train our employees on how to coexist with the sensitive flora and fauna. In Pakistan, all projects areinternally monitored. Third party audits of our operations were also carried out in environmentally sensitive areas. All projectsites were restored and rehabilitated after completion of various activities.2.6 HSE PenaltiesIn 2010, the <strong>MOL</strong> Group had to pay a total of HUF 11.06 million in HSE- related penalties. Moreover, the lower penalties in thisyear compared to the previous one (2009: HUF 14.7 million) also contain the penalties paid by companies of the INA Group(HUF 2.63 million). If the data is compared, excluding the INA Group, both the number and the total amount of penaltiesdemonstrated a marked decrease (HUF 8.43 million in 2010).Certain administrative mistakes in environmental data reporting (HUF 1.5 million) or the faulty performance of ourcontractors (HUF 1.91 million) were responsible for some of the fines. However, occasional minor breaches of work-safetyregulations were also the cause of 0.9 million HUF in penalties.Considering the HSE aspects of the oil and gas industry, the level of compliance has clearly improved in recent years. However,we still are not satisfied with this figure and our goal is to reduce all health, safety and environmentally related penalties tozero throughout the entire <strong>MOL</strong> Group.<strong>MOL</strong> did not receive any HSE-related non-monetary sanctions in 2010.Sustainability184 <strong>MOL</strong> Group annual report 2010 185