MOL GROUP Annual Report
MOL GROUP Annual Report
MOL GROUP Annual Report
- No tags were found...

Create successful ePaper yourself
Turn your PDF publications into a flip-book with our unique Google optimized e-Paper software.
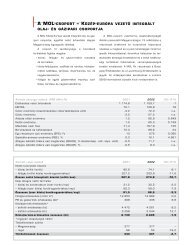
are conditional on the EU Emissions Trading System (with INA: 67%). Verified emissions reached the level of 5.13 Mt CO2in 2009. While in 2010, emissions before verification stand at 4.87 Mt; representing a 5% reduction.In addition to a reduction in absolute figures, we have also met our internal target - ‘to reduce specific CO2 emissions byone percent year over year’ - in the Refining Division (-12.9%). However, due to three unplanned shutdowns in 2010, thespecific emissions of Petrochemicals slightly increased (+4.2%).Direct and indirect energy consumption by source (GJ)2009* 2010*Change2009-2010(%)2010Total <strong>MOL</strong>GroupNatural Gas 20,556,116 20,511,218 -0.2% 26,855,282Other hydrocarbon (e.g. fuel) 54,311,663 52,273,334 -3.8% 76,982,160Total primary energy consumption 74,867,779 72,784,552 -2.8% 103,837,442Electricity 7,476,690 8,080,860 +8.1% 9,301,736Other indirect energy (steam, heat, etc.) 9,204,196 8,604,808 -6.5% 9,924,985Total indirect energy consumption 16,680,887 16,685,668 0.0% 19,226,722Total energy consumption 91,548,666 89,470,220 -2.3% 123,064,164* excluding IES and INAEach division involved contributed its share to this positive performance. Energy efficiency improvement at the RefiningDivision, covered by the ‘EIFFEL Programme’ and managed by DS Development, delivered an estimated reduction of fuelconsumption by 35 TJ/y (Terajoules/year). Some reductions were also due to a decrease in crude oil processing and generalturnarounds (general offstream period).Similar programmes have been running in the Exploration and Production Divisions as well. In Hungary, the ENRAC (EnergyRationalization) Project’s goal has been to increase energy and maintenance savings resulting in reduced upstream CO2 emissions. Loweremissions have mainly been achieved by modernising heating systems and changing compressor drives from gas to electric engines.Flaring is a specific issue for Exploration and Production installations. Our goal is to flare or vent gas only for technologicalreasons and in case of emergencies. This goal has been fulfilled 100% in Hungary. In Pakistan, we achieved a thirty-five percentreduction in the volume of flared gas, while in Russia we are working on the utilisation of associated gas instead of flaring.In the Petrochemical (Petchem) Division, we have established a Demand Management Team responsible for the monitoringand optimisation of energy utilisation from the source to the consumer, and for the investigation of losses. Improved steammanagement resulted in a 1.3 TJ reduction in steam losses at TVK (HU), and an additional 3 TJ cut in steam consumption atSPC (SK). Almost 3 kt of CO2 were saved as a result of better process regulation and the revamp of furnaces at the SPC SteamCracker, thus saving 15 million m 3 of natural gas.At the Natural Gas Transmission Division, <strong>MOL</strong> reduced energy consumption through the optimisation of gas turbineoperation and boiler performance. Through the application of new techniques during pipeline servicing and maintenance,we reduced the volume of flared gases.In 2010, the energy efficiency audit of key production plants was continued by the <strong>MOL</strong> Energy Efficiency Team. The audit of TVKwas completed, and we aim to begin implementation of the action plan in 2011. The audit of the Exploration and Production AlgyőGas Preparation Plan (HU) was also initiated in mid-2010, and will be finalised in Q1 of 2011.2.2 Air emissionsIn 2010, the total air emissions (excluding GHG) decreased significantly (by 11.7%) compared to 2009, if we take into accountthe same set of companies. If we include the air emission data of IES and INA, then air emissions practically doubled.At Exploration and Production, the biggest area for operational improvement was at INA Upstream, where the IPO Project(assessment of INA d.d. hydrocarbon production activities at Posavina and Slavonija) was launched in 2010. Last year wereduced our internal gas consumption (feed gas, heating).At Refining, we have focused on basic pollutant emission reductions. The Leakage Detection and Repair (LDAR) Programmeat the Slovnaft Refinery for monitoring of volatile organic compounds (VOC) has been operating for several years, andwe have now started a similar programme at the Danube Refinery as well. The aim is to have more reliable information onVOC emissions, creating the basis for a VOC reduction programme. Through the ongoing energy efficiency programme,we can reduce the air pollutant emissions from flared gas.There were two major projects in the Petchem Division. In order to meet the air emission standards within our operatingpermit, we increased the capacity and renovated the quench oil unloading station. The second project was the installationof fixed roofs on floating roof tanks. The aim was to reduce the evaporation of raw materials.Compared to the Refining or Petchem Divisions, the Logistics and Retail Divisions are not so significant in terms of airemissions, but we do not consider being of lower priority though. With the aim of VOC reduction in mind, we beganreconstruction of the Vapor Recovery Unit (VRU) at the Komárom Logistics Depot, and initiated a programme (LDAR) tomeasure VOCs at the Korneuburg Depot.2.3 Water managementWater withdrawalsConsidering the same set of reporting companies as previous years, at a group level we achieved a further reductionin total water withdrawals. Compared to our baseline year 2008 the amount of water withdrawn decreased by nearly35% as a combined effect of a decrease in production due to turnarounds, a change in the product slate, minortechnological improvements and the outsourcing of the Slovnaft Thermal Power Plant to CEZ-<strong>MOL</strong> joint venturecompany in 2009.As a result of INA and IES consolidation, the total volume of water withdrawals in <strong>MOL</strong> Group increased by 68%.Compared to 2009, the volume of wastewater recycled and reused also increased by 25% and reached 2.7% of totalwater withdrawals. At the Sisak Refinery (INA) we plan several technological developments aimed at achieving a 17%reduction of water withdrawals in the near future. In Mantova Refinery (IES) a study was prepared on water consumptionreduction.In our petrochemical plants we reduced water withdrawals by 6.5% (compared to the baseline year 2008) and the ratio ofrecycled wastewater compared to 2009 raised by half. Based on water technology improvements planned in TVK, a savingof 0.6 million m 3 /y water can be achieved from 2011.Total water withdrawals by source (th m 3 )2008* 2009*2010(withoutINA)Change2008-2010(%)2010Total <strong>MOL</strong>GroupMunicipal water supplies or other water utilities 2,186.4 2,175.5 2,449.1 +12.0% 3,523.7Surface Water Withdrawals 65,612.4 50,653.2 36,267.6 -44.7% 68,512.4Ground Water Withdrawals 9,421.9 8,950.4 10,610.4 +12.6% 14,766.4Rainwater Collected Directly and Stored 591.1 583.8 9.0 -98.5% 565.3Wastewater from Other Organisations 8,233.9 6,054.6 6,794.3 -17.5% 6,794.3Total Water Withdrawals 86,045.8 68,417.5 56,130.4 -34.8% 94,162.1SustainabilityTotal air emissions (excl. GHG) by type (t)2008 20092010(withoutINA)Change2008-2010(%)2010Total <strong>MOL</strong>GroupSO2 (Sulphur Dioxide) 8,805 4,389 2,940 -66.6% 13,142NOx (Nitrogen Oxides) 5,054 3,937 3,442 -31.9% 7,874VOC (Volatile Organic Compounds) 5,627 3,683 4,133 -26.5% 4,211CO (Carbon Monoxide) 824 880 864 +4.8% 1,599PM (Particulate Matter) 298 205 184 -38.2% 361Total 20,608 13,094 11,563 -43.9% 27,187*2008 and 2009 data were restated to correct local misinterpretation of the indicator: groundwater withdrawals from remediation processes at the Slovnaft Refinery were excluded.Water dischargeCompared to 2009, the total discharge volume and the amount of contaminants such as total petroleum hydrocarbon(TPH), chemical and biological oxygen demand (COD, BOD) and suspended solids (SS) increased due to data consolidation(TPH 69%, COD 32%, BOD 50%, SS 16%). Without incorporating data from INA and IES our performance was stable withno significant changes in the amount of emitted contaminants.In line with the Water Framework Directive, our focus has shifted from the physical and chemical quality of water to itsbiological quality. We utilise Whole Effluent Assessment (WEA) methodology, comprising ecotoxicity, persistence andbioaccumulation tests in the Hungarian and the Slovakian refineries to assess the ecological impacts of final refinery182 <strong>MOL</strong> Group annual report 2010 183