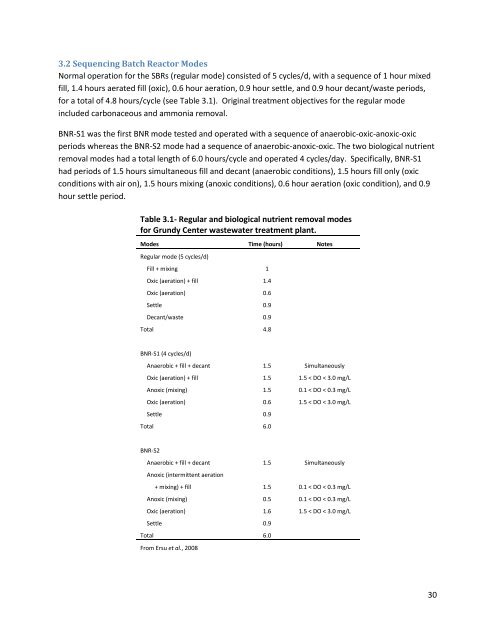
3.2 Sequencing Batch Reactor ModesNormal operation for the SBRs (regular mode) consisted of 5 cycles/d, with a sequence of 1 hour mixedfill, 1.4 hours aerated fill (oxic), 0.6 hour aeration, 0.9 hour settle, and 0.9 hour decant/waste periods,for a total of 4.8 hours/cycle (see Table 3.1). Original treatment objectives for the regular modeincluded carbonaceous and ammonia removal.BNR-S1 was the first BNR mode tested and operated with a sequence of anaerobic-oxic-anoxic-oxicperiods whereas the BNR-S2 mode had a sequence of anaerobic-anoxic-oxic. The two biological nutrientremoval modes had a total length of 6.0 hours/cycle and operated 4 cycles/day. Specifically, BNR-S1had periods of 1.5 hours simultaneous fill and decant (anaerobic conditions), 1.5 hours fill only (oxicconditions with air on), 1.5 hours mixing (anoxic conditions), 0.6 hour aeration (oxic condition), and 0.9hour settle period.Table 3.1- Regular and biological nutrient removal modesfor Grundy Center wastewater treatment plant.Modes Time (hours) NotesRegular mode (5 cycles/d)Fill + mixing 1Oxic (aeration) + fill 1.4Oxic (aeration) 0.6Settle 0.9Decant/waste 0.9Total 4.8BNR-S1 (4 cycles/d)Anaerobic + fill + decant 1.5 SimultaneouslyOxic (aeration) + fill 1.5 1.5 < DO < 3.0 mg/LAnoxic (mixing) 1.5 0.1 < DO < 0.3 mg/LOxic (aeration) 0.6 1.5 < DO < 3.0 mg/LSettle 0.9Total 6.0BNR-S2Anaerobic + fill + decant 1.5 SimultaneouslyAnoxic (intermittent aeration+ mixing) + fill 1.5 0.1 < DO < 0.3 mg/LAnoxic (mixing) 0.5 0.1 < DO < 0.3 mg/LOxic (aeration) 1.6 1.5 < DO < 3.0 mg/LSettle 0.9Total 6.0From Ersu et al., 200830
BNR-S2 operated with 1.5 hours simultaneous fill and decant (anaerobic conditions), 1.5 hours fill(anoxic conditions and intermittent aeration), 0.5 hour mixing only (anoxic conditions), 1.6 hoursaeration, and 0.9 hour settle period.The intermittent aeration during the anoxic period(s) of the BNR-S1 and BNR-S2 modes maintained adissolved oxygen concentration (D.O.) between 0.1 and 0.3 mg/L. This aeration was provided in order toprevent anaerobic conditions and to promote a favorable anoxic environment. During the oxic period ofboth modes, the D.O. concentration was maintained between 1.5 and 3.0 mg/L. An SRT ofapproximately 13 days was maintained through the wasting of mixed liquor towards the end of thesettling period.3.3 Data InterpretationEnviroSim’s influent specifier (IS) requires the input of several wastewater variables in order to fractionthe influent COD according to the specific application (See Appendix I). This requires the collection of asignificant amount of data that is not typically monitored by wastewater operators. Due to cost, thecollection of this data was not possible for this report. Assumptions were documented and a full list ofdetailed calculations can be found in Appendix I. In general, three types of values were used: valuesderived directly from data available taken in the form of an average, values estimated using ratios ofhistorical data, and values estimated using ratios of IS default values. More information on wastewatercharacterization and COD fractioning is presented by Melcer et al. (2003).Available data for the analysis include influent data collected in 2004 and 2005 as shown in Table 3.2and 24-hour composite samples of influent and effluent taken for each of the 3 cycle sequences asshown in Table 3.3.Performance data for the regular mode (Table 3.3) was collected during the month of May, 2005 with atemperature of approximately 20˚C. This data is based on 3 sets of 24-hour composite samples andincludes influent and effluent values for pH, soluble COD (sCOD), 5-day biochemical oxygen demand(BOD 5 ), total nitrogen, ammonia, nitrite, nitrate, total phosphorus, and effluent values for totalsuspended solids (TSS).Performance data for BNR-S1 presented in Table 3.3 is based on a total of 8 composite samples thatwere collected during August, 2005 with a temperature of approximately 24˚C. Influent and effluentvalues are given for pH, sCOD, BOD 5 , total nitrogen, ammonia, nitrite, nitrate, and total phosphorus andeffluent values are given for TSS.Two different time periods are compared for BNR-S2 in Table 3.3. A total of 5 composite samples weretaken for the first period during the month of October, 2005 with a temperature of approximately 20˚C.The second period tested BNR-S2 during winter conditions when eight 24-hour composite samples weretaken during the months of January and February, 2006 with a temperature of approximately 15.7 o C .Monthly monitoring reports to the Iowa Department of Natural Resources were also available for theappropriate time period. An emphasis was placed on the use of data from corresponding time periodsto the respective cycle. For example, data for the regular cycle in Table 3.3 was collected during the31