

E-Andrew Sindt Creative Component S11.pdf
E-Andrew Sindt Creative Component S11.pdf
E-Andrew Sindt Creative Component S11.pdf

You also want an ePaper? Increase the reach of your titles
YUMPU automatically turns print PDFs into web optimized ePapers that Google loves.
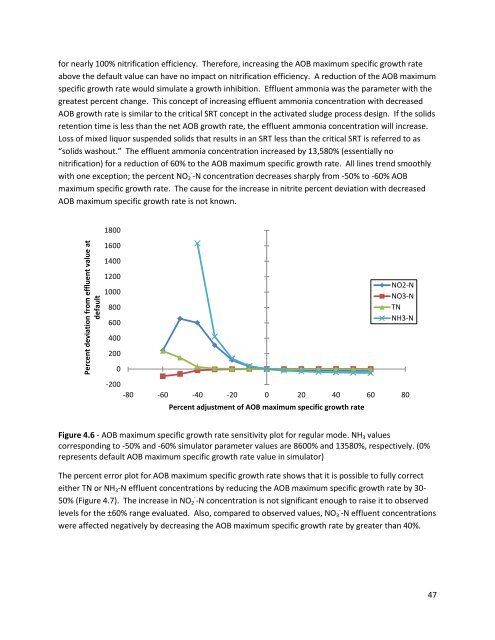
Percent deviation from effluent value atdefaultfor nearly 100% nitrification efficiency. Therefore, increasing the AOB maximum specific growth rateabove the default value can have no impact on nitrification efficiency. A reduction of the AOB maximumspecific growth rate would simulate a growth inhibition. Effluent ammonia was the parameter with thegreatest percent change. This concept of increasing effluent ammonia concentration with decreasedAOB growth rate is similar to the critical SRT concept in the activated sludge process design. If the solidsretention time is less than the net AOB growth rate, the effluent ammonia concentration will increase.Loss of mixed liquor suspended solids that results in an SRT less than the critical SRT is referred to as“solids washout.” The effluent ammonia concentration increased by 13,580% (essentially nonitrification) for a reduction of 60% to the AOB maximum specific growth rate. All lines trend smoothlywith one exception; the percent NO 2 - -N concentration decreases sharply from -50% to -60% AOBmaximum specific growth rate. The cause for the increase in nitrite percent deviation with decreasedAOB maximum specific growth rate is not known.18001600140012001000800600NO2-NNO3-NTNNH3-N4002000-200-80 -60 -40 -20 0 20 40 60 80Percent adjustment of AOB maximum specific growth rateFigure 4.6 - AOB maximum specific growth rate sensitivity plot for regular mode. NH 3 valuescorresponding to -50% and -60% simulator parameter values are 8600% and 13580%, respectively. (0%represents default AOB maximum specific growth rate value in simulator)The percent error plot for AOB maximum specific growth rate shows that it is possible to fully correcteither TN or NH 3 -N effluent concentrations by reducing the AOB maximum specific growth rate by 30-50% (Figure 4.7). The increase in NO 2 - -N concentration is not significant enough to raise it to observedlevels for the ±60% range evaluated. Also, compared to observed values, NO 3 - -N effluent concentrationswere affected negatively by decreasing the AOB maximum specific growth rate by greater than 40%.47


