

E-Andrew Sindt Creative Component S11.pdf
E-Andrew Sindt Creative Component S11.pdf
E-Andrew Sindt Creative Component S11.pdf

You also want an ePaper? Increase the reach of your titles
YUMPU automatically turns print PDFs into web optimized ePapers that Google loves.
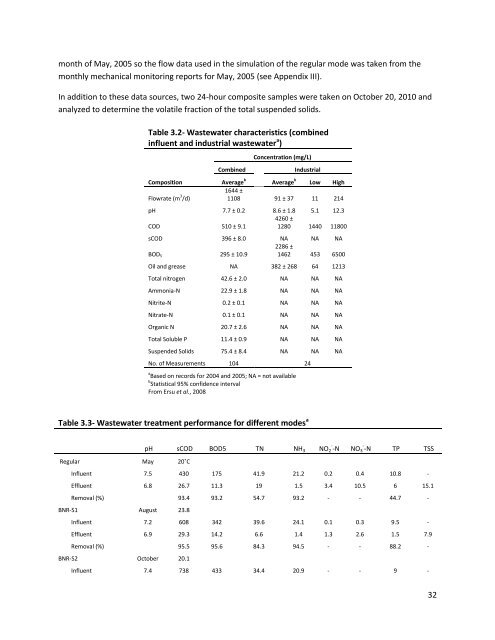
month of May, 2005 so the flow data used in the simulation of the regular mode was taken from themonthly mechanical monitoring reports for May, 2005 (see Appendix III).In addition to these data sources, two 24-hour composite samples were taken on October 20, 2010 andanalyzed to determine the volatile fraction of the total suspended solids.Table 3.2- Wastewater characteristics (combinedinfluent and industrial wastewater a )CombinedConcentration (mg/L)IndustrialComposition Average b Average b Low High1644 ±Flowrate (m 3 /d)1108 91 ± 37 11 214pH 7.7 ± 0.2 8.6 ± 1.8 5.1 12.34260 ±COD 510 ± 9.11280 1440 11800sCOD 396 ± 8.0 NA NA NA2286 ±BOD 5 295 ± 10.91462 453 6500Oil and grease NA 382 ± 268 64 1213Total nitrogen 42.6 ± 2.0 NA NA NAAmmonia-N 22.9 ± 1.8 NA NA NANitrite-N 0.2 ± 0.1 NA NA NANitrate-N 0.1 ± 0.1 NA NA NAOrganic N 20.7 ± 2.6 NA NA NATotal Soluble P 11.4 ± 0.9 NA NA NASuspended Solids 75.4 ± 8.4 NA NA NANo. of Measurements 104 24a Based on records for 2004 and 2005; NA = not availableb Statistical 95% confidence intervalFrom Ersu et al., 2008Table 3.3- Wastewater treatment performance for different modes apH sCOD BOD5 TN NH 3 NO - 2 -N NO - 3 -N TP TSSRegular May 20˚CInfluent 7.5 430 175 41.9 21.2 0.2 0.4 10.8 -Effluent 6.8 26.7 11.3 19 1.5 3.4 10.5 6 15.1Removal (%) 93.4 93.2 54.7 93.2 - - 44.7 -BNR-S1 August 23.8Influent 7.2 608 342 39.6 24.1 0.1 0.3 9.5 -Effluent 6.9 29.3 14.2 6.6 1.4 1.3 2.6 1.5 7.9Removal (%) 95.5 95.6 84.3 94.5 - - 88.2 -BNR-S2 October 20.1Influent 7.4 738 433 34.4 20.9 - - 9 -32


