

The Limits of Mathematics and NP Estimation in ... - Chichilnisky
The Limits of Mathematics and NP Estimation in ... - Chichilnisky
The Limits of Mathematics and NP Estimation in ... - Chichilnisky
- No tags were found...

Create successful ePaper yourself
Turn your PDF publications into a flip-book with our unique Google optimized e-Paper software.
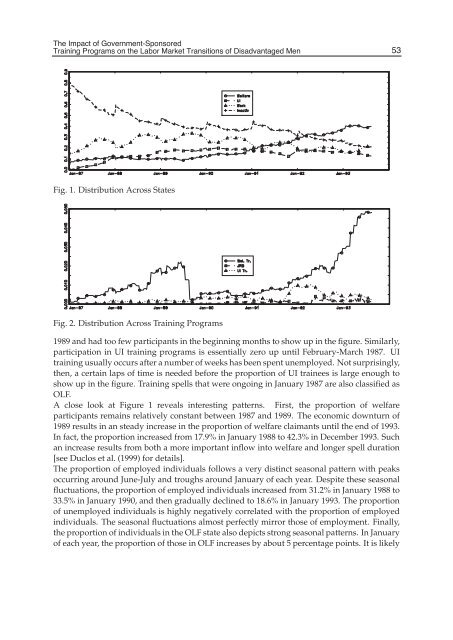
<strong>The</strong> Impact <strong>of</strong> Government-SponsoredTra<strong>in</strong><strong>in</strong>g Programs on the Labor Market Transitions <strong>of</strong> Disadvantaged Men<strong>The</strong> Impact <strong>of</strong> Government-Sponsored Tra<strong>in</strong><strong>in</strong>g Programs on the Labor Market Transitions <strong>of</strong> Disadvantaged Men 753Fig. 1. Distribution Across StatesFig. 2. Distribution Across Tra<strong>in</strong><strong>in</strong>g Programs1989 <strong>and</strong> had too few participants <strong>in</strong> the beg<strong>in</strong>n<strong>in</strong>g months to show up <strong>in</strong> the figure. Similarly,participation <strong>in</strong> UI tra<strong>in</strong><strong>in</strong>g programs is essentially zero up until February-March 1987. UItra<strong>in</strong><strong>in</strong>g usually occurs after a number <strong>of</strong> weeks has been spent unemployed. Not surpris<strong>in</strong>gly,then, a certa<strong>in</strong> laps <strong>of</strong> time is needed before the proportion <strong>of</strong> UI tra<strong>in</strong>ees is large enough toshow up <strong>in</strong> the figure. Tra<strong>in</strong><strong>in</strong>g spells that were ongo<strong>in</strong>g <strong>in</strong> January 1987 are also classified asOLF.A close look at Figure 1 reveals <strong>in</strong>terest<strong>in</strong>g patterns. First, the proportion <strong>of</strong> welfareparticipants rema<strong>in</strong>s relatively constant between 1987 <strong>and</strong> 1989. <strong>The</strong> economic downturn <strong>of</strong>1989 results <strong>in</strong> an steady <strong>in</strong>crease <strong>in</strong> the proportion <strong>of</strong> welfare claimants until the end <strong>of</strong> 1993.In fact, the proportion <strong>in</strong>creased from 17.9% <strong>in</strong> January 1988 to 42.3% <strong>in</strong> December 1993. Suchan <strong>in</strong>crease results from both a more important <strong>in</strong>flow <strong>in</strong>to welfare <strong>and</strong> longer spell duration[see Duclos et al. (1999) for details].<strong>The</strong> proportion <strong>of</strong> employed <strong>in</strong>dividuals follows a very dist<strong>in</strong>ct seasonal pattern with peaksoccurr<strong>in</strong>g around June-July <strong>and</strong> troughs around January <strong>of</strong> each year. Despite these seasonalfluctuations, the proportion <strong>of</strong> employed <strong>in</strong>dividuals <strong>in</strong>creased from 31.2% <strong>in</strong> January 1988 to33.5% <strong>in</strong> January 1990, <strong>and</strong> then gradually decl<strong>in</strong>ed to 18.6% <strong>in</strong> January 1993. <strong>The</strong> proportion<strong>of</strong> unemployed <strong>in</strong>dividuals is highly negatively correlated with the proportion <strong>of</strong> employed<strong>in</strong>dividuals. <strong>The</strong> seasonal fluctuations almost perfectly mirror those <strong>of</strong> employment. F<strong>in</strong>ally,the proportion <strong>of</strong> <strong>in</strong>dividuals <strong>in</strong> the OLF state also depicts strong seasonal patterns. In January<strong>of</strong> each year, the proportion <strong>of</strong> those <strong>in</strong> OLF <strong>in</strong>creases by about 5 percentage po<strong>in</strong>ts. It is likely


