

The Limits of Mathematics and NP Estimation in ... - Chichilnisky
The Limits of Mathematics and NP Estimation in ... - Chichilnisky
The Limits of Mathematics and NP Estimation in ... - Chichilnisky
- No tags were found...

Create successful ePaper yourself
Turn your PDF publications into a flip-book with our unique Google optimized e-Paper software.
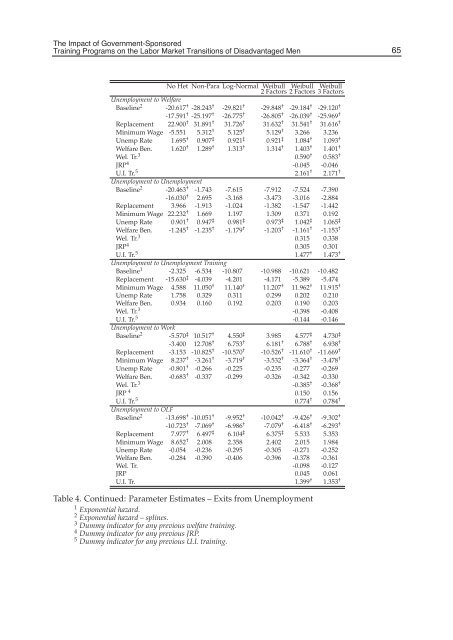
<strong>The</strong> Impact <strong>of</strong> Government-SponsoredTra<strong>in</strong><strong>in</strong>g Programs on the Labor Market Transitions <strong>of</strong> Disadvantaged Men<strong>The</strong> Impact <strong>of</strong> Government-Sponsored Tra<strong>in</strong><strong>in</strong>g Programs on the Labor Market Transitions <strong>of</strong> Disadvantaged Men 1965No Het Non-Para Log-Normal Weibull Weibull Weibull2 Factors 2 Factors 3 FactorsUnemployment to WelfareBasel<strong>in</strong>e 2 -20.617 † -28.243 † -29.821 † -29.848 † -29.184 † -29.120 †-17.591 † -25.197 † -26.775 † -26.805 † -26.039 † -25.969 †Replacement 22.900 † 31.891 † 31.726 † 31.632 † 31.541 † 31.616 †M<strong>in</strong>imum Wage -5.551 5.312 † 5.125 † 5.129 † 3.266 3.236Unemp Rate 1.695 † 0.907 ‡ 0.921 ‡ 0.921 ‡ 1.084 † 1.093 †Welfare Ben. 1.620 † 1.289 † 1.313 † 1.314 † 1.403 † 1.401 †Wel. Tr. 3 0.590 † 0.583 †JRP 4 -0.045 -0.046U.I. Tr. 5 2.161 † 2.171 †Unemployment to UnemploymentBasel<strong>in</strong>e 2 -20.463 † -1.743 -7.615 -7.912 -7.524 -7.390-16.030 † 2.695 -3.168 -3.473 -3.016 -2.884Replacement 3.966 -1.913 -1.024 -1.382 -1.547 -1.442M<strong>in</strong>imum Wage 22.232 † 1.669 1.197 1.309 0.371 0.192Unemp Rate 0.901 † 0.947 ‡ 0.981 ‡ 0.973 ‡ 1.042 ‡ 1.065 ‡Welfare Ben. -1.245 † -1.235 † -1.179 † -1.203 † -1.161 † -1.153 †Wel. Tr. 3 0.315 0.338JRP 4 0.305 0.301U.I. Tr. 5 1.477 † 1.473 †Unemployment to Unemployment Tra<strong>in</strong><strong>in</strong>gBasel<strong>in</strong>e 1 -2.325 -6.534 -10.807 -10.988 -10.621 -10.482Replacement -15.630 ‡ -4.039 -4.201 -4.171 -5.389 -5.474M<strong>in</strong>imum Wage 4.588 11.050 † 11.140 † 11.207 † 11.962 † 11.915 †Unemp Rate 1.758 0.329 0.311 0.299 0.202 0.210Welfare Ben. 0.934 0.160 0.192 0.203 0.190 0.203Wel. Tr. 3 -0.398 -0.408U.I. Tr. 5 -0.144 -0.146Unemployment to WorkBasel<strong>in</strong>e 2 -5.570 ‡ 10.517 † 4.550 ‡ 3.985 4.577 ‡ 4.730 ‡-3.400 12.708 † 6.753 † 6.181 † 6.788 † 6.938 †Replacement -3.153 -10.825 † -10.570 † -10.526 † -11.610 † -11.669 †M<strong>in</strong>imum Wage 8.237 † -3.261 † -3.719 † -3.532 † -3.364 † -3.478 †Unemp Rate -0.801 † -0.266 -0.225 -0.235 -0.277 -0.269Welfare Ben. -0.683 † -0.337 -0.299 -0.326 -0.342 -0.330Wel. Tr. 3 -0.385 † -0.368 †JRP 4 0.150 0.156U.I. Tr. 5 0.774 † 0.784 †Unemployment to OLFBasel<strong>in</strong>e 2 -13.698 † -10.051 † -9.952 † -10.042 † -9.426 † -9.302 †-10.723 † -7.069 † -6.986 † -7.079 † -6.418 † -6.293 †Replacement 7.977 † 6.497 ‡ 6.104 ‡ 6.375 ‡ 5.533 5.353M<strong>in</strong>imum Wage 8.652 † 2.008 2.358 2.402 2.015 1.984Unemp Rate -0.054 -0.236 -0.295 -0.305 -0.271 -0.252Welfare Ben. -0.284 -0.390 -0.406 -0.396 -0.378 -0.361Wel. Tr. -0.098 -0.127JRP 0.045 0.061U.I. Tr. 1.399 † 1.353 †Table 4. Cont<strong>in</strong>ued: Parameter Estimates – Exits from Unemployment1 Exponential hazard.2 Exponential hazard – spl<strong>in</strong>es.3 Dummy <strong>in</strong>dicator for any previous welfare tra<strong>in</strong><strong>in</strong>g.4 Dummy <strong>in</strong>dicator for any previous JRP.5 Dummy <strong>in</strong>dicator for any previous U.I. tra<strong>in</strong><strong>in</strong>g.


