

The Limits of Mathematics and NP Estimation in ... - Chichilnisky
The Limits of Mathematics and NP Estimation in ... - Chichilnisky
The Limits of Mathematics and NP Estimation in ... - Chichilnisky
- No tags were found...

Create successful ePaper yourself
Turn your PDF publications into a flip-book with our unique Google optimized e-Paper software.
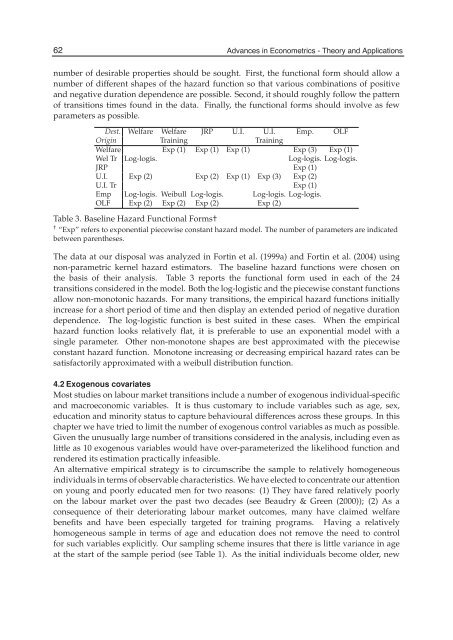
62 Advances <strong>in</strong> Econometrics - <strong>The</strong>ory <strong>and</strong> Applications16 Will-be-set-by-IN-TECHnumber <strong>of</strong> desirable properties should be sought. First, the functional form should allow anumber <strong>of</strong> different shapes <strong>of</strong> the hazard function so that various comb<strong>in</strong>ations <strong>of</strong> positive<strong>and</strong> negative duration dependence are possible. Second, it should roughly follow the pattern<strong>of</strong> transitions times found <strong>in</strong> the data. F<strong>in</strong>ally, the functional forms should <strong>in</strong>volve as fewparameters as possible.Dest. Welfare Welfare JRP U.I. U.I. Emp. OLFOrig<strong>in</strong> Tra<strong>in</strong><strong>in</strong>g Tra<strong>in</strong><strong>in</strong>gWelfare Exp (1) Exp (1) Exp (1) Exp (3) Exp (1)Wel Tr Log-logis. Log-logis. Log-logis.JRP Exp (1)U.I. Exp (2) Exp (2) Exp (1) Exp (3) Exp (2)U.I. Tr Exp (1)Emp Log-logis. Weibull Log-logis. Log-logis. Log-logis.OLF Exp (2) Exp (2) Exp (2) Exp (2)Table 3. Basel<strong>in</strong>e Hazard Functional Forms†† “Exp” refers to exponential piecewise constant hazard model. <strong>The</strong> number <strong>of</strong> parameters are <strong>in</strong>dicatedbetween parentheses.<strong>The</strong> data at our disposal was analyzed <strong>in</strong> Fort<strong>in</strong> et al. (1999a) <strong>and</strong> Fort<strong>in</strong> et al. (2004) us<strong>in</strong>gnon-parametric kernel hazard estimators. <strong>The</strong> basel<strong>in</strong>e hazard functions were chosen onthe basis <strong>of</strong> their analysis. Table 3 reports the functional form used <strong>in</strong> each <strong>of</strong> the 24transitions considered <strong>in</strong> the model. Both the log-logistic <strong>and</strong> the piecewise constant functionsallow non-monotonic hazards. For many transitions, the empirical hazard functions <strong>in</strong>itially<strong>in</strong>crease for a short period <strong>of</strong> time <strong>and</strong> then display an extended period <strong>of</strong> negative durationdependence. <strong>The</strong> log-logistic function is best suited <strong>in</strong> these cases. When the empiricalhazard function looks relatively flat, it is preferable to use an exponential model with as<strong>in</strong>gle parameter. Other non-monotone shapes are best approximated with the piecewiseconstant hazard function. Monotone <strong>in</strong>creas<strong>in</strong>g or decreas<strong>in</strong>g empirical hazard rates can besatisfactorily approximated with a weibull distribution function.4.2 Exogenous covariatesMost studies on labour market transitions <strong>in</strong>clude a number <strong>of</strong> exogenous <strong>in</strong>dividual-specific<strong>and</strong> macroeconomic variables. It is thus customary to <strong>in</strong>clude variables such as age, sex,education <strong>and</strong> m<strong>in</strong>ority status to capture behavioural differences across these groups. In thischapter we have tried to limit the number <strong>of</strong> exogenous control variables as much as possible.Given the unusually large number <strong>of</strong> transitions considered <strong>in</strong> the analysis, <strong>in</strong>clud<strong>in</strong>g even aslittle as 10 exogenous variables would have over-parameterized the likelihood function <strong>and</strong>rendered its estimation practically <strong>in</strong>feasible.An alternative empirical strategy is to circumscribe the sample to relatively homogeneous<strong>in</strong>dividuals <strong>in</strong> terms <strong>of</strong> observable characteristics. We have elected to concentrate our attentionon young <strong>and</strong> poorly educated men for two reasons: (1) <strong>The</strong>y have fared relatively poorlyon the labour market over the past two decades (see Beaudry & Green (2000)); (2) As aconsequence <strong>of</strong> their deteriorat<strong>in</strong>g labour market outcomes, many have claimed welfarebenefits <strong>and</strong> have been especially targeted for tra<strong>in</strong><strong>in</strong>g programs. Hav<strong>in</strong>g a relativelyhomogeneous sample <strong>in</strong> terms <strong>of</strong> age <strong>and</strong> education does not remove the need to controlfor such variables explicitly. Our sampl<strong>in</strong>g scheme <strong>in</strong>sures that there is little variance <strong>in</strong> ageat the start <strong>of</strong> the sample period (see Table 1). As the <strong>in</strong>itial <strong>in</strong>dividuals become older, new


