

The Limits of Mathematics and NP Estimation in ... - Chichilnisky
The Limits of Mathematics and NP Estimation in ... - Chichilnisky
The Limits of Mathematics and NP Estimation in ... - Chichilnisky
- No tags were found...

Create successful ePaper yourself
Turn your PDF publications into a flip-book with our unique Google optimized e-Paper software.
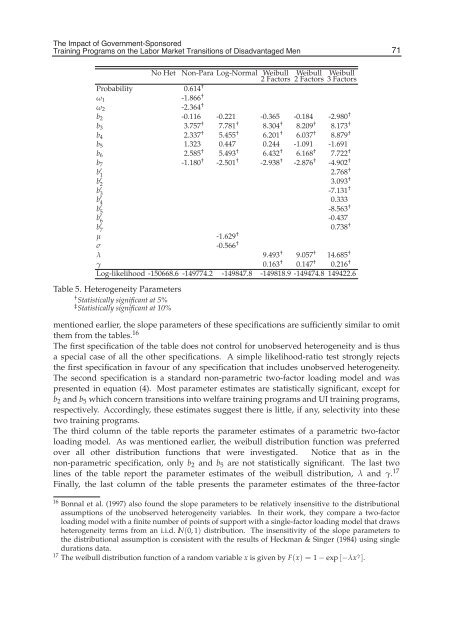
<strong>The</strong> Impact <strong>of</strong> Government-SponsoredTra<strong>in</strong><strong>in</strong>g Programs on the Labor Market Transitions <strong>of</strong> Disadvantaged Men<strong>The</strong> Impact <strong>of</strong> Government-Sponsored Tra<strong>in</strong><strong>in</strong>g Programs on the Labor Market Transitions <strong>of</strong> Disadvantaged Men 2571No Het Non-Para Log-Normal Weibull Weibull Weibull2 Factors 2 Factors 3 FactorsProbability 0.614 †ω 1 -1.866 †ω 2 -2.364 †b 2 -0.116 -0.221 -0.365 -0.184 -2.980 †b 3 3.757 † 7.781 † 8.304 † 8.209 † 8.173 †b 4 2.337 † 5.455 † 6.201 † 6.037 † 8.879 †b 5 1.323 0.447 0.244 -1.091 -1.691b 6 2.585 † 5.493 † 6.432 † 6.168 † 7.722 †b 7 -1.180 † -2.501 † -2.938 † -2.876 † -4.902 †b 1 ′ 2.768 †b 2 ′ 3.093 †b 3 ′ -7.131 †b 4 ′ 0.333b 5 ′ -8.563 †b 6 ′ -0.437b 7 ′ 0.738 †μ -1.629 †σ -0.566 †λ 9.493 † 9.057 † 14.685 †γ 0.163 † 0.147 † 0.216 †Log-likelihood -150668.6 -149774.2 -149847.8 -149818.9 -149474.8 149422.6Table 5. Heterogeneity Parameters† Statistically significant at 5%‡ Statistically significant at 10%mentioned earlier, the slope parameters <strong>of</strong> these specifications are sufficiently similar to omitthem from the tables. 16<strong>The</strong> first specification <strong>of</strong> the table does not control for unobserved heterogeneity <strong>and</strong> is thusa special case <strong>of</strong> all the other specifications. A simple likelihood-ratio test strongly rejectsthe first specification <strong>in</strong> favour <strong>of</strong> any specification that <strong>in</strong>cludes unobserved heterogeneity.<strong>The</strong> second specification is a st<strong>and</strong>ard non-parametric two-factor load<strong>in</strong>g model <strong>and</strong> waspresented <strong>in</strong> equation (4). Most parameter estimates are statistically significant, except forb 2 <strong>and</strong> b 5 which concern transitions <strong>in</strong>to welfare tra<strong>in</strong><strong>in</strong>g programs <strong>and</strong> UI tra<strong>in</strong><strong>in</strong>g programs,respectively. Accord<strong>in</strong>gly, these estimates suggest there is little, if any, selectivity <strong>in</strong>to thesetwo tra<strong>in</strong><strong>in</strong>g programs.<strong>The</strong> third column <strong>of</strong> the table reports the parameter estimates <strong>of</strong> a parametric two-factorload<strong>in</strong>g model. As was mentioned earlier, the weibull distribution function was preferredover all other distribution functions that were <strong>in</strong>vestigated. Notice that as <strong>in</strong> thenon-parametric specification, only b 2 <strong>and</strong> b 5 are not statistically significant. <strong>The</strong> last twol<strong>in</strong>es <strong>of</strong> the table report the parameter estimates <strong>of</strong> the weibull distribution, λ <strong>and</strong> γ. 17F<strong>in</strong>ally, the last column <strong>of</strong> the table presents the parameter estimates <strong>of</strong> the three-factor16 Bonnal et al. (1997) also found the slope parameters to be relatively <strong>in</strong>sensitive to the distributionalassumptions <strong>of</strong> the unobserved heterogeneity variables. In their work, they compare a two-factorload<strong>in</strong>g model with a f<strong>in</strong>ite number <strong>of</strong> po<strong>in</strong>ts <strong>of</strong> support with a s<strong>in</strong>gle-factor load<strong>in</strong>g model that drawsheterogeneity terms from an i.i.d. IN (0, 1) distribution. <strong>The</strong> <strong>in</strong>sensitivity <strong>of</strong> the slope parameters tothe distributional assumption is consistent with the results <strong>of</strong> Heckman & S<strong>in</strong>ger (1984) us<strong>in</strong>g s<strong>in</strong>gledurations data.17 <strong>The</strong> weibull distribution function <strong>of</strong> a r<strong>and</strong>om variable x is given by F(x) =1 − exp [−λx γ ].


