Design-Expert 5.0 Reference Manual - Statease.info
Design-Expert 5.0 Reference Manual - Statease.info
Design-Expert 5.0 Reference Manual - Statease.info

You also want an ePaper? Increase the reach of your titles
YUMPU automatically turns print PDFs into web optimized ePapers that Google loves.
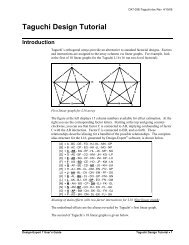
You can optimize a virtually unlimited number of responses on the same graph.<br />
However, they must first be analyzed. In the first tutorial you developed a quadratic<br />
model for conversion and a linear model for activity. Only those responses for which<br />
you enter lower and/or upper levels will be plotted.<br />
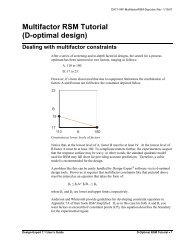
The shaded areas on the graphical optimization plot do not meet the selection criteria.<br />
The lines mark the high or low boundaries on the responses. The clear (or colored<br />
yellow if you haven’t made changes to your color scheme) “window” shows where you<br />
can set the factors to satisfy the requirements on both responses.<br />
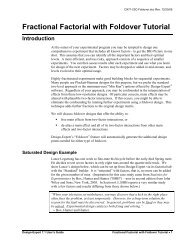
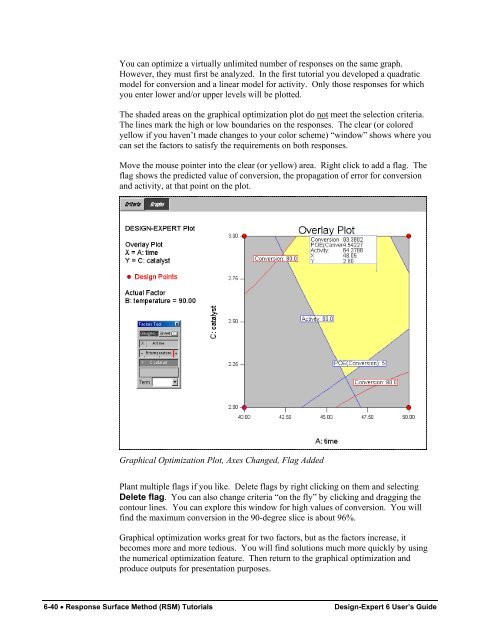
Move the mouse pointer into the clear (or yellow) area. Right click to add a flag. The<br />
flag shows the predicted value of conversion, the propagation of error for conversion<br />
and activity, at that point on the plot.<br />
Graphical Optimization Plot, Axes Changed, Flag Added<br />
Plant multiple flags if you like. Delete flags by right clicking on them and selecting<br />
Delete flag. You can also change criteria “on the fly” by clicking and dragging the<br />
contour lines. You can explore this window for high values of conversion. You will<br />
find the maximum conversion in the 90-degree slice is about 96%.<br />
Graphical optimization works great for two factors, but as the factors increase, it<br />
becomes more and more tedious. You will find solutions much more quickly by using<br />
the numerical optimization feature. Then return to the graphical optimization and<br />
produce outputs for presentation purposes.<br />
6-40 • Response Surface Method (RSM) Tutorials <strong>Design</strong>-<strong>Expert</strong> 6 User’s Guide