Design-Expert 5.0 Reference Manual - Statease.info
Design-Expert 5.0 Reference Manual - Statease.info
Design-Expert 5.0 Reference Manual - Statease.info

You also want an ePaper? Increase the reach of your titles
YUMPU automatically turns print PDFs into web optimized ePapers that Google loves.
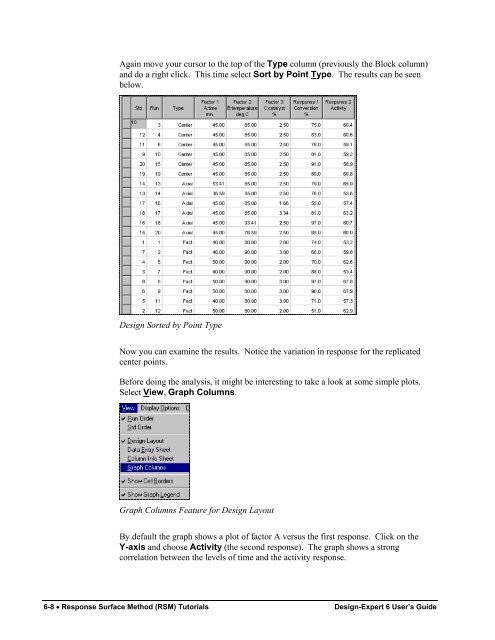
Again move your cursor to the top of the Type column (previously the Block column)<br />
and do a right click. This time select Sort by Point Type. The results can be seen<br />
below.<br />
<strong>Design</strong> Sorted by Point Type<br />
Now you can examine the results. Notice the variation in response for the replicated<br />
center points.<br />
Before doing the analysis, it might be interesting to take a look at some simple plots.<br />
Select View, Graph Columns.<br />
Graph Columns Feature for <strong>Design</strong> Layout<br />
By default the graph shows a plot of factor A versus the first response. Click on the<br />
Y-axis and choose Activity (the second response). The graph shows a strong<br />
correlation between the levels of time and the activity response.<br />
6-8 • Response Surface Method (RSM) Tutorials <strong>Design</strong>-<strong>Expert</strong> 6 User’s Guide