- Page 1 and 2:
The Extent, Nature and Effectivenes
- Page 3 and 4:
iii
- Page 6 and 7:
AcknowledgementsThe research team w
- Page 8 and 9:
viii
- Page 10 and 11:
The Nature and Extent of Identifica
- Page 12 and 13:
Table 28. School-Based Provisions:
- Page 14 and 15:
policy (Ministry of Education, 2002
- Page 17 and 18:
Introduction to the Literature Revi
- Page 19 and 20:
national and international theory a
- Page 21 and 22:
literature in relation to New Zeala
- Page 23 and 24:
DEFINITIONS AND CHARACTERISTICSTher
- Page 25 and 26:
It is also important to remember th
- Page 27 and 28:
classroom. She further recommends t
- Page 29 and 30:
combination. The desirable approach
- Page 31 and 32:
identification and the opportunitie
- Page 33 and 34:
words, teacher identification in yo
- Page 35 and 36:
Tests of intelligence. Tests of int
- Page 37 and 38:
2003). The bias reported in these t
- Page 39 and 40:
mentioned, it must be recognised th
- Page 41:
that ‘all parents think their chi
- Page 46:
The adaptations made to content, pr
- Page 49 and 50:
same time, relationships can be bui
- Page 51 and 52:
6. The classroom has a comfortable,
- Page 53 and 54:
Freeman (1998) conceives enrichment
- Page 55 and 56:
egular classroom can also alleviate
- Page 57 and 58:
• These learners should have oppo
- Page 59 and 60:
learning there seems to be reluctan
- Page 61 and 62:
Swiatek (2002) concludes that the S
- Page 63 and 64:
Perhaps in the historical debate ov
- Page 65 and 66:
The New Zealand Curriculum recognis
- Page 67 and 68:
Stocktake Report to the Minister of
- Page 69 and 70:
The model reflects many of the prin
- Page 71 and 72:
• The establishment of learning g
- Page 73 and 74:
challenging for them” (Fielder et
- Page 75 and 76:
(1986) believe that if grouping is
- Page 77 and 78:
EDUCATING GIFTED AND TALENTED STUDE
- Page 79 and 80:
and exposure to higher level thinki
- Page 81 and 82:
5. Ensure the student is equipped a
- Page 83 and 84:
• A documented programme for an i
- Page 85 and 86:
There are some suggestions that IEP
- Page 87 and 88:
Potential Weaknesses• Time consum
- Page 89 and 90:
always be concerned to protect stud
- Page 91 and 92:
Similar findings were reported by J
- Page 93 and 94:
Potential Strengths• Working in t
- Page 95 and 96:
Kaplan (1999) outlines the followin
- Page 97 and 98:
Potential weaknesses of learning ce
- Page 99 and 100:
Developed specifically as a model f
- Page 101 and 102:
earlier in this review of the liter
- Page 103 and 104:
• A practical option for small or
- Page 105 and 106:
programmes of this nature. Macleod
- Page 107 and 108:
have significant but varying positi
- Page 109 and 110:
• Missed instruction (Cox & Danie
- Page 111 and 112:
describe American secondary schools
- Page 113 and 114:
felt that instruction was more stud
- Page 115 and 116:
Recommendations for Effective Pract
- Page 117 and 118:
Outcomes for StudentsEarly entry is
- Page 119 and 120:
difficulties, Cornell et al. (1991)
- Page 121 and 122:
opportunities for acceleration and
- Page 123 and 124:
Burns and Lewis (2000) conducted a
- Page 125 and 126: way, competitions allow students a
- Page 127 and 128: hundred and sixteen of these Olympi
- Page 129 and 130: her wings so that those special abi
- Page 131 and 132: programmes: establish a “definiti
- Page 133 and 134: determine what features are essenti
- Page 135 and 136: their responses (Harrison, 2003). O
- Page 137 and 138: ideas beyond the school curriculum,
- Page 139 and 140: • Narrow selection criteria inclu
- Page 141 and 142: Culture free and culture fair tests
- Page 143 and 144: In her examination of successful pr
- Page 145 and 146: potential (Torrance, 1984). Mentors
- Page 147 and 148: Provisions: ProblemsShortage of cul
- Page 149 and 150: content and context of learning is
- Page 151 and 152: concept/phenomenon, threat of isola
- Page 153 and 154: Similarly, Doidge (1990) recommends
- Page 155 and 156: cooperative team approach is helpfu
- Page 157 and 158: student outcomes is briefly discuss
- Page 159 and 160: a link between programme evaluation
- Page 161 and 162: • Community and parental contribu
- Page 163 and 164: Cathcart (1996) states that, “som
- Page 165 and 166: • Is passionate about discipline,
- Page 167 and 168: Whilst all of these are promising p
- Page 169 and 170: THE NATURE AND EXTENT OF IDENTIFICA
- Page 171 and 172: profiles or cumulative work folders
- Page 173 and 174: QuestionnaireThis purpose of the qu
- Page 175: questionnaire the quality of these
- Page 179 and 180: of these schools reported one, wher
- Page 181 and 182: Table 9. Written Policies and Proce
- Page 183 and 184: We are very much in our conception
- Page 185 and 186: Table 11. School-Based Concept or D
- Page 187 and 188: Some schools recognised the potenti
- Page 189 and 190: Table 12. Formal Identification by
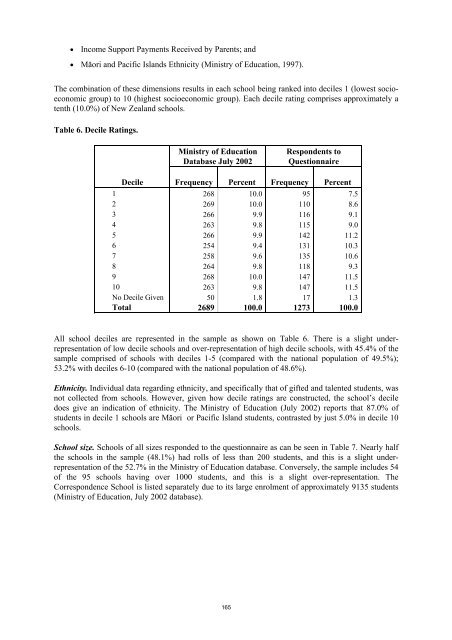
- Page 191 and 192: The frequencies for this section ar
- Page 193 and 194: Table 17. Identification Methods: C
- Page 195 and 196: Table 19. Identification Methods: S
- Page 197 and 198: Summary: Formal Identification of G
- Page 199 and 200: Table 24. Community-Based Provision
- Page 201 and 202: Table 25. School-based Provision by
- Page 203 and 204: Provisions: Intellectual/Academic.
- Page 205 and 206: Table 31. Provisions: Gifted and Ta
- Page 207 and 208: primary schools are making schoolwi
- Page 209 and 210: Resource provision, staffing, is a
- Page 211 and 212: Case StudiesTo add richness to this
- Page 213 and 214: 7. Measures to ensure identificatio
- Page 215 and 216: Table 36. Profile of School A.Overa
- Page 217 and 218: intelligences, inquiry learning, an
- Page 219 and 220: School B’s JourneyThis full prima
- Page 221 and 222: Table 38. Profile of School C.Overa
- Page 223 and 224: included. Teachers chose which acti
- Page 225 and 226: School D’s JourneyWhile it is dif
- Page 227 and 228:
Table 40. Profile of School E.Overa
- Page 229 and 230:
isks. As part of this inclusive phi
- Page 231 and 232:
School F’s JourneyPrior to the pr
- Page 233 and 234:
Table 42. Profile of School G.Overa
- Page 235 and 236:
School electives and the annual sch
- Page 237 and 238:
School H’s JourneyThe gifted and
- Page 239 and 240:
School I’s JourneyThe journey for
- Page 241 and 242:
Table 45. Profile of School J.Overa
- Page 243 and 244:
community who may be able to suppor
- Page 245 and 246:
IdentificationDuring the in-depth i
- Page 247 and 248:
1. A talent detector form that asks
- Page 249 and 250:
The process in one school for the i
- Page 251 and 252:
Have an established gifted register
- Page 253 and 254:
Withdrawal programmes. The ‘succe
- Page 255 and 256:
It’s actually releasing children
- Page 257 and 258:
Difficulties. Providing for gifted
- Page 259 and 260:
Knowing that Mäori kids like team
- Page 261 and 262:
To counteract the previously mentio
- Page 263 and 264:
classroom teacher for inclusion in
- Page 265 and 266:
additional funds for competitions,
- Page 267 and 268:
classes during Enrichment. The coor
- Page 269 and 270:
One of the main day to day operatio
- Page 271 and 272:
The intermediate school teachers of
- Page 273 and 274:
cluster programme, as well as press
- Page 275 and 276:
not all students could participate,
- Page 277 and 278:
levels of schooling, and overall or
- Page 279 and 280:
The rationale for professional read
- Page 281 and 282:
DiscussionThe purpose in this resea
- Page 283 and 284:
Schoolwide organisation of gifted a
- Page 285 and 286:
inclusive nature of giftedness and
- Page 287 and 288:
provisions in their procedures. Mee
- Page 289 and 290:
ConclusionsThis section of the rese
- Page 291 and 292:
eflect the core principles of gifte
- Page 293 and 294:
ReferencesAdams, C., & Cross, T. (1
- Page 295 and 296:
Betts, G. (1985). Autonomous Learne
- Page 297 and 298:
Callahan, C.M., Hunsaker, S.L., Ada
- Page 299 and 300:
Cross, T. (1994). Alternative inqui
- Page 301 and 302:
Feldhusen, J.F. (1997). Educating t
- Page 303 and 304:
Freeman, J. (1998). Educating the v
- Page 305 and 306:
Heller, K.A., & Schofield, N.J. (20
- Page 307 and 308:
Kaufmann, F.A., Harrel, G., Milam,
- Page 309 and 310:
Lewis, G. (2002). Alternatives to a
- Page 311 and 312:
McGee, C., Jones, A., Cowie, B., Hi
- Page 313 and 314:
Montgomery, W. (2001). Creating cul
- Page 315 and 316:
Plunkett, M., & Harvey, D. (1995).
- Page 317 and 318:
Renzulli, J.S. (1986). Systems and
- Page 319 and 320:
Robinson, A. (1991). Cooperative le
- Page 321 and 322:
Slavin, R.E. (1988). Synthesis of r
- Page 323 and 324:
Timutimu-Thorpe, H. (1988). E awhi
- Page 325 and 326:
Van Tassel-Baska, J. (2000). Theory
- Page 327 and 328:
APPENDIX ALiterature Review Templat
- Page 329 and 330:
Section 2: THEORY-BASED REFERENCES
- Page 331 and 332:
APPENDIX BSchool Questionnaire20033
- Page 333 and 334:
321
- Page 335 and 336:
323
- Page 337 and 338:
325
- Page 339 and 340:
APPENDIX CInformation Sheets andInt
- Page 341 and 342:
The Extent and Nature of Identifica
- Page 343 and 344:
The Extent and Nature of Identifica
- Page 345 and 346:
As compensation for your school’s
- Page 347 and 348:
APPENDIX DConsent Forms335
- Page 349:
The Extent and Nature of Identifica