The Extent, Nature and Effectiveness of Planned Approaches in ...
The Extent, Nature and Effectiveness of Planned Approaches in ...
The Extent, Nature and Effectiveness of Planned Approaches in ...

You also want an ePaper? Increase the reach of your titles
YUMPU automatically turns print PDFs into web optimized ePapers that Google loves.
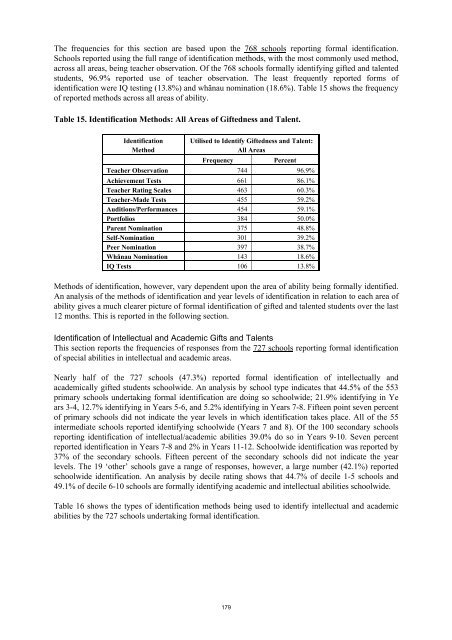
<strong>The</strong> frequencies for this section are based upon the 768 schools report<strong>in</strong>g formal identification.Schools reported us<strong>in</strong>g the full range <strong>of</strong> identification methods, with the most commonly used method,across all areas, be<strong>in</strong>g teacher observation. Of the 768 schools formally identify<strong>in</strong>g gifted <strong>and</strong> talentedstudents, 96.9% reported use <strong>of</strong> teacher observation. <strong>The</strong> least frequently reported forms <strong>of</strong>identification were IQ test<strong>in</strong>g (13.8%) <strong>and</strong> whänau nom<strong>in</strong>ation (18.6%). Table 15 shows the frequency<strong>of</strong> reported methods across all areas <strong>of</strong> ability.Table 15. Identification Methods: All Areas <strong>of</strong> Giftedness <strong>and</strong> Talent.IdentificationMethodUtilised to Identify Giftedness <strong>and</strong> Talent:All AreasFrequencyPercentTeacher Observation 744 96.9%Achievement Tests 661 86.1%Teacher Rat<strong>in</strong>g Scales 463 60.3%Teacher-Made Tests 455 59.2%Auditions/Performances 454 59.1%Portfolios 384 50.0%Parent Nom<strong>in</strong>ation 375 48.8%Self-Nom<strong>in</strong>ation 301 39.2%Peer Nom<strong>in</strong>ation 397 38.7%Whänau Nom<strong>in</strong>ation 143 18.6%IQ Tests 106 13.8%Methods <strong>of</strong> identification, however, vary dependent upon the area <strong>of</strong> ability be<strong>in</strong>g formally identified.An analysis <strong>of</strong> the methods <strong>of</strong> identification <strong>and</strong> year levels <strong>of</strong> identification <strong>in</strong> relation to each area <strong>of</strong>ability gives a much clearer picture <strong>of</strong> formal identification <strong>of</strong> gifted <strong>and</strong> talented students over the last12 months. This is reported <strong>in</strong> the follow<strong>in</strong>g section.Identification <strong>of</strong> Intellectual <strong>and</strong> Academic Gifts <strong>and</strong> TalentsThis section reports the frequencies <strong>of</strong> responses from the 727 schools report<strong>in</strong>g formal identification<strong>of</strong> special abilities <strong>in</strong> <strong>in</strong>tellectual <strong>and</strong> academic areas.Nearly half <strong>of</strong> the 727 schools (47.3%) reported formal identification <strong>of</strong> <strong>in</strong>tellectually <strong>and</strong>academically gifted students schoolwide. An analysis by school type <strong>in</strong>dicates that 44.5% <strong>of</strong> the 553primary schools undertak<strong>in</strong>g formal identification are do<strong>in</strong>g so schoolwide; 21.9% identify<strong>in</strong>g <strong>in</strong> Years 3-4, 12.7% identify<strong>in</strong>g <strong>in</strong> Years 5-6, <strong>and</strong> 5.2% identify<strong>in</strong>g <strong>in</strong> Years 7-8. Fifteen po<strong>in</strong>t seven percent<strong>of</strong> primary schools did not <strong>in</strong>dicate the year levels <strong>in</strong> which identification takes place. All <strong>of</strong> the 55<strong>in</strong>termediate schools reported identify<strong>in</strong>g schoolwide (Years 7 <strong>and</strong> 8). Of the 100 secondary schoolsreport<strong>in</strong>g identification <strong>of</strong> <strong>in</strong>tellectual/academic abilities 39.0% do so <strong>in</strong> Years 9-10. Seven percentreported identification <strong>in</strong> Years 7-8 <strong>and</strong> 2% <strong>in</strong> Years 11-12. Schoolwide identification was reported by37% <strong>of</strong> the secondary schools. Fifteen percent <strong>of</strong> the secondary schools did not <strong>in</strong>dicate the yearlevels. <strong>The</strong> 19 ‘other’ schools gave a range <strong>of</strong> responses, however, a large number (42.1%) reportedschoolwide identification. An analysis by decile rat<strong>in</strong>g shows that 44.7% <strong>of</strong> decile 1-5 schools <strong>and</strong>49.1% <strong>of</strong> decile 6-10 schools are formally identify<strong>in</strong>g academic <strong>and</strong> <strong>in</strong>tellectual abilities schoolwide.Table 16 shows the types <strong>of</strong> identification methods be<strong>in</strong>g used to identify <strong>in</strong>tellectual <strong>and</strong> academicabilities by the 727 schools undertak<strong>in</strong>g formal identification.179