& Candlestick Point Hunters Point Shipyard Phase II - Office of ...
& Candlestick Point Hunters Point Shipyard Phase II - Office of ...
& Candlestick Point Hunters Point Shipyard Phase II - Office of ...
- No tags were found...

You also want an ePaper? Increase the reach of your titles
YUMPU automatically turns print PDFs into web optimized ePapers that Google loves.
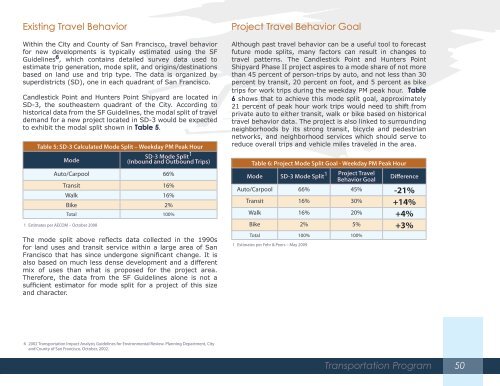
Existing Travel BehaviorWithin the City and County <strong>of</strong> San Francisco, travel behaviorfor new developments is typically estimated using the SFGuidelines 6 , which contains detailed survey data used toestimate trip generation, mode split, and origins/destinationsbased on land use and trip type. The data is organized bysuperdistricts (SD), one in each quadrant <strong>of</strong> San Francisco.<strong>Candlestick</strong> <strong>Point</strong> and <strong>Hunters</strong> <strong>Point</strong> <strong>Shipyard</strong> are located inSD-3, the southeastern quadrant <strong>of</strong> the City. According tohistorical data from the SF Guidelines, the modal split <strong>of</strong> traveldemand for a new project located in SD-3 would be expectedto exhibit the modal split shown in Table 5.Table 5: SD-3 Calculated Mode Split – Weekday PM Peak HourSD-3 Mode SplitMode1(Inbound and Outbound Trips)Auto/Carpool 66%1 Estimates per AECOM – October 2008Transit 16%Walk 16%Bike 2%Total 100%The mode split above reflects data collected in the 1990sfor land uses and transit service within a large area <strong>of</strong> SanFrancisco that has since undergone significant change. It isalso based on much less dense development and a differentmix <strong>of</strong> uses than what is proposed for the project area.Therefore, the data from the SF Guidelines alone is not asufficient estimator for mode split for a project <strong>of</strong> this sizeand character.Project Travel Behavior GoalAlthough past travel behavior can be a useful tool to forecastfuture mode splits, many factors can result in changes totravel patterns. The <strong>Candlestick</strong> <strong>Point</strong> and <strong>Hunters</strong> <strong>Point</strong><strong>Shipyard</strong> <strong>Phase</strong> <strong>II</strong> project aspires to a mode share <strong>of</strong> not morethan 45 percent <strong>of</strong> person-trips by auto, and not less than 30percent by transit, 20 percent on foot, and 5 percent as biketrips for work trips during the weekday PM peak hour. Table6 shows that to achieve this mode split goal, approximately21 percent <strong>of</strong> peak hour work trips would need to shift fromprivate auto to either transit, walk or bike based on historicaltravel behavior data. The project is also linked to surroundingneighborhoods by its strong transit, bicycle and pedestriannetworks, and neighborhood services which should serve toreduce overall trips and vehicle miles traveled in the area.Table 6: Project Mode Split Goal - Weekday PM Peak HourMode SD-3 Mode Split 1 Project TravelBehavior GoalDifferenceAuto/Carpool 66% 45% -21%Transit 16% 30% +14%Walk 16% 20% +4%Bike 2% 5% +3%Total 100% 100%1 Estimates per Fehr & Peers – May 20096 2002 Transportation Impact Analysis Guidelines for Environmental Review. Planning Department, Cityand County <strong>of</strong> San Francisco. October, 2002.Transportation Program50