& Candlestick Point Hunters Point Shipyard Phase II - Office of ...
& Candlestick Point Hunters Point Shipyard Phase II - Office of ...
& Candlestick Point Hunters Point Shipyard Phase II - Office of ...
- No tags were found...
Create successful ePaper yourself
Turn your PDF publications into a flip-book with our unique Google optimized e-Paper software.
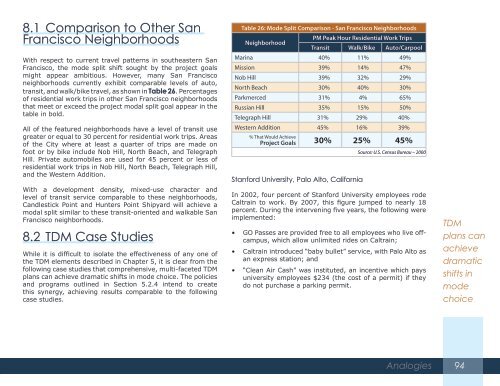
8.1 Comparison to Other SanFrancisco NeighborhoodsWith respect to current travel patterns in southeastern SanFrancisco, the mode split shift sought by the project goalsmight appear ambitious. However, many San Francisconeighborhoods currently exhibit comparable levels <strong>of</strong> auto,transit, and walk/bike travel, as shown in Table 26. Percentages<strong>of</strong> residential work trips in other San Francisco neighborhoodsthat meet or exceed the project modal split goal appear in thetable in bold.All <strong>of</strong> the featured neighborhoods have a level <strong>of</strong> transit usegreater or equal to 30 percent for residential work trips. Areas<strong>of</strong> the City where at least a quarter <strong>of</strong> trips are made onfoot or by bike include Nob Hill, North Beach, and TelegraphHill. Private automobiles are used for 45 percent or less <strong>of</strong>residential work trips in Nob Hill, North Beach, Telegraph Hill,and the Western Addition.With a development density, mixed-use character andlevel <strong>of</strong> transit service comparable to these neighborhoods,<strong>Candlestick</strong> <strong>Point</strong> and <strong>Hunters</strong> <strong>Point</strong> <strong>Shipyard</strong> will achieve amodal split similar to these transit-oriented and walkable SanFrancisco neighborhoods.8.2 TDM Case StudiesWhile it is difficult to isolate the effectiveness <strong>of</strong> any one <strong>of</strong>the TDM elements described in Chapter 5, it is clear from thefollowing case studies that comprehensive, multi-faceted TDMplans can achieve dramatic shifts in mode choice. The policiesand programs outlined in Section 5.2.4 intend to createthis synergy, achieving results comparable to the followingcase studies.Table 26: Mode Split Comparison - San Francisco NeighborhoodsNeighborhoodPM Peak Hour Residential Work TripsTransit Walk/Bike Auto/CarpoolMarina 40% 11% 49%Mission 39% 14% 47%Nob Hill 39% 32% 29%North Beach 30% 40% 30%Parkmerced 31% 4% 65%Russian Hill 35% 15% 50%Telegraph Hill 31% 29% 40%Western Addition 45% 16% 39%% That Would AchieveProject Goals 30% 25% 45%Stanford University, Palo Alto, CaliforniaSource: U.S. Census Bureau – 2000In 2002, four percent <strong>of</strong> Stanford University employees rodeCaltrain to work. By 2007, this figure jumped to nearly 18percent. During the intervening five years, the following wereimplemented:• GO Passes are provided free to all employees who live <strong>of</strong>fcampus,which allow unlimited rides on Caltrain;• Caltrain introduced “baby bullet” service, with Palo Alto asan express station; and• “Clean Air Cash” was instituted, an incentive which paysuniversity employees $234 (the cost <strong>of</strong> a permit) if theydo not purchase a parking permit.TDMplans canachievedramaticshifts inmodechoiceAnalogies94


