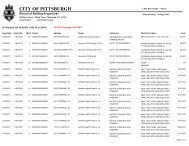
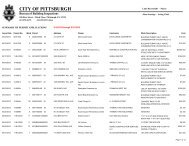
Crime by Neighborhood, <strong>2011</strong>60Crimes by Neighborhood is divided into three distinct sections: Total Crime Rate (Part I & Part II) per 100Citizens by neighborhood.Total Crime Rate is calculated by combining the total Part I Crimes and Part II Crimes <strong>of</strong> a neighborhood,dividing the sum by the fixed neighborhood population (using 2000 census data) and then multiplying by 100.The resulting crime rate should not be used to compare one neighborhood to another; but, rather as a startingpoint to study crime in your neighborhood.If you are concerned with your neighborhood crime rate, use the following two sections (Part I and Part IICrimes by Neighborhood) <strong>of</strong> Crimes by Neighborhood to investigate what type crime is driving the crime ratein your neighborhood. Page numbers for each neighborhood and their respective Part I and Part II Crime areprovided for your reference.You should then work with the police, your community leaders and your neighborhood watch groups to helpdevelop methods to reduce that crime. As noted, the crime rate only reflects the rate <strong>of</strong> crime as it impacts ourfixed population and does not consider the many visitors that come into our <strong>City</strong> to work and to enjoythemselves.Neighborhood2000PopulationTotal Part ICrimes<strong>Annual</strong><strong>Report</strong>Page#Total PartII Crimes<strong>Annual</strong><strong>Report</strong>Page#Total Crimes per100 CitizensAllegheny Center 886 94 63 156 69 28.2Allegheny West 508 34 63 43 69 15.2Allentown 3,220 210 63 346 69 17.3Arlington 1,999 64 63 109 69 8.7Arlington Heights 238 21 63 36 69 23.9Banksville 4,540 64 63 135 69 4.4Bedford Dwellings 2,109 87 63 120 69 9.8Beechview 8,772 178 63 408 69 6.7Beltzhoover 2,783 95 63 180 69 9.9Bloomfield 9,089 394 63 365 69 8.4Bluff 6,423 114 63 228 70 5.3Bon Air 889 21 63 63 70 9.4Brighton Heights 8,050 236 63 335 70 7.1Brookline 14,318 247 63 535 70 5.5California Kirkbride 973 78 63 139 70 22.3Carrick 10,685 483 64 732 70 11.4Central Business District 2,721 800 64 870 70 61.4Central Lawrenceville 5,106 158 64 251 70 8.0Central North Side 3,200 164 64 195 70 11.2Central Oakland 5,281 231 64 223 70 8.6Chartiers <strong>City</strong> 595 13 64 30 71 7.2Chateau 39 63 64 90 71 392.3Crafton Heights 4,199 112 64 221 71 7.9Crawford Roberts 2,724 115 64 160 71 10.1Duquesne Heights 2,696 66 64 87 71 5.7East Allegheny 2,635 248 64 370 71 23.5
61Neighborhood2000PopulationTotal Part ICrimes<strong>Annual</strong><strong>Report</strong>Page#Total PartII Crimes<strong>Annual</strong><strong>Report</strong>Page#Total Crimes per100 CitizensEast Carnegie 485 20 64 20 71 8.2East Hills 3,951 142 64 243 71 9.7East Liberty 6,871 471 64 560 71 15.0Elliott 2,954 94 64 194 71 9.7Esplen 495 30 65 56 72 17.4Fairywood 1,099 20 65 38 72 5.3Fineview 1,751 72 65 160 72 13.2Friendship 1,791 73 65 68 72 7.9Garfield 5,450 186 65 275 72 8.5Glen Hazel 805 14 65 48 72 7.7Greenfield 7,832 125 65 212 72 4.3Hays 457 24 65 30 72 11.8Hazelwood 5,334 183 65 297 72 9.0Highland Park 6,749 172 65 211 72 5.7Homewood North 4,522 242 65 382 73 13.8Homewood South 3,647 202 65 369 73 15.7Homewood West 1,114 66 65 148 73 19.2Knoxville 4,432 240 65 488 73 16.4Larimer 2,602 193 65 209 73 15.4Lincoln LemingtonBelmar 5,550 260 66 307 73 10.2Lincoln Place 3,671 57 66 87 73 3.9Lower Lawrenceville 2,585 123 66 154 73 10.7Manchester 2,506 134 66 198 73 13.2Marshall Shadeland 6,951 274 66 330 73 8.7Middle Hill 2,143 110 66 268 74 17.6Morningside 3,549 68 66 97 74 4.6Mount Oliver 584 10 66 31 74 7.0Mount Washington 9,878 499 66 543 74 10.5New Homestead 937 5 66 20 74 2.7North Oakland 9,857 189 66 179 74 3.7North Shore 270 113 66 165 74 103.0Northview Heights 2,526 77 66 134 74 8.4Oakwood 1,028 17 66 23 74 3.9Overbrook 4,041 88 66 138 74 5.6Perry North 4,669 115 67 241 75 7.6Perry South 5,276 240 67 364 75 11.4Point Breeze 5,665 131 67 91 75 3.9Point Breeze North 2,304 86 67 113 75 8.6Polish Hill 1,488 47 67 69 75 7.8Regent Square 1,131 34 67 12 75 4.1Ridgemont 530 17 67 23 75 7.5Saint Clair 1,453 15 67 15 75 2.1Shadyside 13,754 544 67 342 75 6.4Sheraden 6,049 256 67 476 75 12.1South Oakland 3,007 88 67 124 76 7.1South Shore 56 95 67 199 76 525.0
- Page 3:
family of brands includes Epiphone,
- Page 6:
Message from the Chief of Police6Gr
- Page 9 and 10: 3. Policy:4. Reports:i. information
- Page 11 and 12: ii. Impose appropriate discipline o
- Page 13 and 14: localized coalitions have been form
- Page 15 and 16: 15History of Our BadgeIn 1873, the
- Page 17 and 18: Organization of the Bureau17
- Page 19 and 20: 19Distribution of Officers by RankM
- Page 21 and 22: Distribution of Personnel by Rank,
- Page 23 and 24: Number of Sworn Personnel Hired, 20
- Page 25 and 26: Administration BranchThe Administra
- Page 27 and 28: existence - identities and capabili
- Page 29 and 30: 29• Review daily offense and arre
- Page 31 and 32: Ignition Interlock ClassIn June and
- Page 33 and 34: Central Records and Reports Unit Th
- Page 35 and 36: • Automated Police Reporting Syst
- Page 37 and 38: 37Result of Disciplinary Actions In
- Page 39 and 40: Pittsburgh Police Civil Actions, 20
- Page 41 and 42: Frank Beal v. City of Pittsburgh, E
- Page 43 and 44: Dontae Parrish v. City of Pittsburg
- Page 45 and 46: Diana Rader v. City of Pittsburgh,
- Page 47 and 48: John Anderson v. City of Pittsburgh
- Page 49 and 50: Night Felony (412-323-7147):The Nig
- Page 52 and 53: Operations BranchThe Operations Bra
- Page 54 and 55: 54Special Deployment Division: The
- Page 56 and 57: 56• Greentree Police Department -
- Page 58 and 59: Crime in the City of Pittsburgh, 20
- Page 62 and 63: 62Neighborhood2000PopulationTotal P
- Page 64 and 65: 64Part I Offenses Known toCentralLa
- Page 66 and 67: 66Part I Offenses Known toLaw Enfor
- Page 68 and 69: 68Part I Offenses Known toLaw Enfor
- Page 70 and 71: 70Part II Offenses Known toLaw Enfo
- Page 72 and 73: 72Part II Offenses Known toLaw Enfo
- Page 74 and 75: 74Part II Offenses Known toLaw Enfo
- Page 76 and 77: 76Part II Offenses Known toLaw Enfo
- Page 78 and 79: Homicides in the City of Pittsburgh
- Page 80 and 81: 3. Homicide - Weapon Used:80Homicid
- Page 82 and 83: 7. Offender Prior Involvement with
- Page 84 and 85: 842011 Arrests by Month160014001200
- Page 86 and 87: The following table provides a coun
- Page 88 and 89: 88TotalCallsZone 5 Zone 6Responding
- Page 90 and 91: 90Channel 7 & 8TRUA.M. P.M. Night A
- Page 92 and 93: 92CitywideJanuaryFebruaryMarchApril
- Page 94 and 95: 4. Race and Gender of Driver: The r
- Page 96 and 97: 5. Traffic Stops by Neighborhood:96
- Page 98 and 99: Neighborhood Count PercentSummer Hi
- Page 100 and 101: City of Pittsburgh Police Pursuits
- Page 102 and 103: 9. Date/Time Analysis of Pursuits:1
- Page 104 and 105: h. Violator - Tire Deflation Deploy
- Page 106 and 107: 5. Field Contacts/Warrantless Searc
- Page 108 and 109: Subject Resistance Review, 2011108I
- Page 110 and 111:
Academy 0 0VCFTF 0 0Graffiti Task F
- Page 112 and 113:
Firearms Review112There were 70 fir
- Page 114 and 115:
Pittsburgh Police Deaths, 2011114In
- Page 116 and 117:
Patrolman George J. SalladeOctober
- Page 118:
Notice of Right to File a Complaint