7817 Annual Report 2009.qxd - Shire
7817 Annual Report 2009.qxd - Shire
7817 Annual Report 2009.qxd - Shire

Create successful ePaper yourself
Turn your PDF publications into a flip-book with our unique Google optimized e-Paper software.
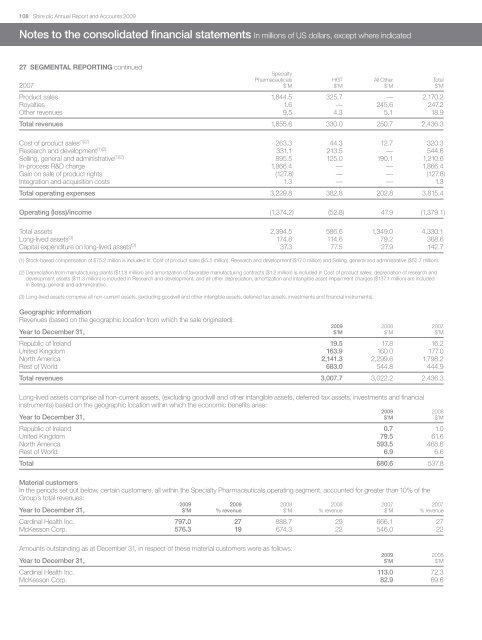
108 <strong>Shire</strong> plc <strong>Annual</strong> <strong>Report</strong> and Accounts 2009Notes to the consolidated financial statements In millions of US dollars, except where indicated27 SEGMENTAL REPORTING continuedSpecialty2007Pharmaceuticals HGT All Other Total$’M $’M $’M $’MProduct sales 1,844.5 325.7 — 2,170.2Royalties 1.6 — 245.6 247.2Other revenues 9.5 4.3 5.1 18.9Total revenues 1,855.6 330.0 250.7 2,436.3Cost of product sales (1)(2) 263.3 44.3 12.7 320.3Research and development (1)(2) 331.1 213.5 — 544.6Selling, general and administrative (1)(2) 895.5 125.0 190.1 1,210.6In-process R&D charge 1,866.4 — — 1,866.4Gain on sale of product rights (127.8) — — (127.8)Integration and acquisition costs 1.3 — — 1.3Total operating expenses 3,229.8 382.8 202.8 3,815.4Operating (loss)/income (1,374.2) (52.8) 47.9 (1,379.1)Total assets 2,394.5 586.6 1,349.0 4,330.1Long-lived assets (3) 174.8 114.6 79.2 368.6Capital expenditure on long-lived assets (3) 37.3 77.5 27.9 142.7(1) Stock-based compensation of $75.2 million is included in: Cost of product sales ($5.5 million), Research and development ($17.0 million) and Selling, general and administrative ($52.7 million).(2) Depreciation from manufacturing plants ($11.8 million) and amortization of favorable manufacturing contracts ($1.2 million) is included in Cost of product sales; depreciation of research anddevelopment assets ($11.3 million) is included in Research and development; and all other depreciation, amortization and intangible asset impairment charges ($137.1 million) are includedin Selling, general and administrative.(3) Long-lived assets comprise all non-current assets, (excluding goodwill and other intangible assets, deferred tax assets, investments and financial instruments).Geographic informationRevenues (based on the geographic location from which the sale originated):2009 2008 2007Year to December 31, $’M $’M $’MRepublic of Ireland 19.5 17.8 16.2United Kingdom 163.9 160.0 177.0North America 2,141.3 2,299.6 1,798.2Rest of World 683.0 544.8 444.9Total revenues 3,007.7 3,022.2 2,436.3Long-lived assets comprise all non-current assets, (excluding goodwill and other intangible assets, deferred tax assets, investments and financialinstruments) based on the geographic location within which the economic benefits arise:2009 2008Year to December 31, $’M $’MRepublic of Ireland 0.7 1.0United Kingdom 79.5 61.6North America 593.5 468.6Rest of World 6.9 6.6Total 680.6 537.8Material customersIn the periods set out below, certain customers, all within the Specialty Pharmaceuticals operating segment, accounted for greater than 10% of theGroup’s total revenues:2009 2009 2008 2008 2007 2007Year to December 31, $’M % revenue $’M % revenue $’M % revenueCardinal Health Inc. 797.0 27 888.7 29 666.1 27McKesson Corp. 576.3 19 674.3 22 546.0 22Amounts outstanding as at December 31, in respect of these material customers were as follows:2009 2008Year to December 31, $’M $’MCardinal Health Inc. 113.0 72.3McKesson Corp. 82.9 69.6