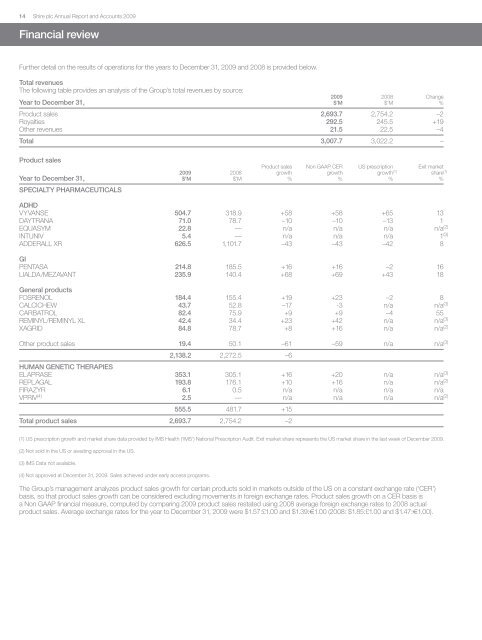
14 <strong>Shire</strong> plc <strong>Annual</strong> <strong>Report</strong> and Accounts 2009Financial reviewFurther detail on the results of operations for the years to December 31, 2009 and 2008 is provided below.Total revenuesThe following table provides an analysis of the Group’s total revenues by source:2009 2008 ChangeYear to December 31, $’M $’M %Product sales 2,693.7 2,754.2 –2Royalties 292.5 245.5 +19Other revenues 21.5 22.5 –4Total 3,007.7 3,022.2 –Product salesProduct sales Non GAAP CER US prescription Exit market2009 2008 growth growth growth (1) share (1)Year to December 31, $’M $’M % % % %SPECIALTY PHARMACEUTICALSADHDVYVANSE 504.7 318.9 +58 +58 +65 13DAYTRANA 71.0 78.7 –10 –10 –13 1EQUASYM 22.8 — n/a n/a n/a n/a (2)INTUNIV 5.4 — n/a n/a n/a 1 (3)ADDERALL XR 626.5 1,101.7 –43 –43 –42 8GIPENTASA 214.8 185.5 +16 +16 –2 16LIALDA/MEZAVANT 235.9 140.4 +68 +69 +43 18General productsFOSRENOL 184.4 155.4 +19 +23 –2 8CALCICHEW 43.7 52.8 –17 -3 n/a n/a (3)CARBATROL 82.4 75.9 +9 +9 –4 55REMINYL/REMINYL XL 42.4 34.4 +23 +42 n/a n/a (3)XAGRID 84.8 78.7 +8 +16 n/a n/a (2)Other product sales 19.4 50.1 –61 –59 n/a n/a (3)2,138.2 2,272.5 –6HUMAN GENETIC THERAPIESELAPRASE 353.1 305.1 +16 +20 n/a n/a (3)REPLAGAL 193.8 176.1 +10 +16 n/a n/a (2)FIRAZYR 6.1 0.5 n/a n/a n/a n/aVPRIV (4) 2.5 — n/a n/a n/a n/a (2)555.5 481.7 +15Total product sales 2,693.7 2,754.2 –2(1) US prescription growth and market share data provided by IMS Health (‘IMS’) National Prescription Audit. Exit market share represents the US market share in the last week of December 2009.(2) Not sold in the US or awaiting approval in the US.(3) IMS Data not available.(4) Not approved at December 31, 2009. Sales achieved under early access programs.The Group’s management analyzes product sales growth for certain products sold in markets outside of the US on a constant exchange rate (‘CER’)basis, so that product sales growth can be considered excluding movements in foreign exchange rates. Product sales growth on a CER basis isa Non GAAP financial measure, computed by comparing 2009 product sales restated using 2008 average foreign exchange rates to 2008 actualproduct sales. Average exchange rates for the year to December 31, 2009 were $1.57:£1.00 and $1.39:€1.00 (2008: $1.85:£1.00 and $1.47:€1.00).
<strong>Shire</strong> plc <strong>Annual</strong> <strong>Report</strong> and Accounts 200915SPECIALTY PHARMACEUTICALSVYVANSE—ADHDThe increase in VYVANSE product sales was driven by higher US prescription demand in 2009 compared to 2008, 9% growth in the US ADHDmarket and price increases. Product sales growth was lower than prescription growth due to lower stocking in 2009 compared to 2008.Litigation proceedings regarding VYVANSE are ongoing. Further information about this litigation can be found in Note 24 to the consolidated financialstatements.INTUNIV—ADHDINTUNIV was launched in the US in November 2009. In line with <strong>Shire</strong>’s revenue recognition policy for launch shipments, initial stocking shipmentshave been deferred and are being recognized into revenue in line with end-user prescription demand. At December 31, 2009 deferred revenueson the balance sheet represented gross sales of $38.8 million.ADDERALL XR—ADHDThe launch by Teva and Impax of their authorized generic versions of ADDERALL XR led to the expected decline in 2009 of branded ADDERALL XRprescription demand, and resulted in higher US sales deductions in 2009 compared to 2008. These factors more than offset the positive impacts ofprice increases taken since the fourth quarter of 2008, and the inclusion in product sales of shipments of authorized generic ADDERALL XR to Tevaand Impax in 2009.Sales deductions represented 47% of branded ADDERALL XR gross sales in the year to December 31, 2009 compared to 25% in the same periodin 2008, following higher Medicaid and Managed Care rebates subsequent to the authorized generic launches.As outlined in Note 3 to the consolidated financial statements, there are potentially different interpretations as to how shipments of authorized genericADDERALL XR to Teva and Impax should be included in the Medicaid rebate calculation pursuant to Medicaid rebate legislation, including the DeficitReduction Act of 2005 (‘Medicaid rebate legislation’). As a result more than one unit rebate amount (‘URA’) is calculable for the purpose of determiningthe Group’s Medicaid rebate liability to States after the authorized generic launch. During 2009 the Group highlighted the different interpretations tothe Centers for Medicare and Medicaid Services (‘CMS’) and submitted data to the CMS for the purpose of computing the URA, based on the Group’sreasonable interpretation of the Medicaid rebate legislation and related guidance. The State Medicaid agencies have invoiced the Group for Medicaidrebates, and the Group has paid these Medicaid rebate invoices, based on this URA. Despite this CMS has the ability to subsequently challenge theGroup’s interpretation of the Medicaid rebate legislation, and require an alternative interpretation to be applied (both retrospectively and prospectively),which could result in a significantly higher Medicaid liability.Throughout 2009 the Group’s management has recorded its accrual for Medicaid rebates based on its best estimate of the rebate payable. For the firstthree quarters of 2009, the Group’s management based this best estimate on an amount that the Group could pay were CMS to challenge theGroup’s interpretation and require an alternative interpretation of the Medicaid rebate legislation to be applied. In the fourth quarter of 2009, the Group’smanagement lowered its best estimate of the Medicaid rebate payable down to be consistent with (i) the Group’s interpretation of the Medicaid rebatelegislation, (ii) the Group’s repeated and consistent submission of price reporting to CMS using the Group’s interpretation of the Medicaid rebatelegislation, (iii) CMS calculating the URA based on that interpretation, (iv) States submitting Medicaid rebate invoices using this URA and (v) <strong>Shire</strong> payingthese invoices. This change of estimate increased ADDERALL XR product sales by $97.7 million in the fourth quarter of 2009 (of which $73.6 millionrelated to ADDERALL XR product sales recognized in the first three quarters of 2009).In determining its best estimate of the Medicaid rebate liability at December 31, 2009 the Group’s management has considered a number of factorstaken in combination (including the receipt of a further quarter’s invoices from the States with a URA based on the Group’s interpretation of theMedicaid rebate legislation and related guidance, and the Group’s likely response were CMS to employ an alternative interpretation of the Medicaidrebate legislation). Any future change in the Group’s interpretation which results in a change of estimate could significantly decrease sales ofADDERALL XR in the period of any such change in estimate.The Group strongly believes that its interpretation of the Medicaid rebate legislation is reasonable and correct. However, CMS could disagree with theGroup’s interpretation, and require the Group to apply an alternative interpretation of the Medicaid rebate legislation and pay up to $210 million abovethe recorded liability. This would represent a URA substantially in excess of the unit sales price of ADDERALL XR and accordingly be in excess of theapproximate amount of the full cost to the States of reimbursement for Medicaid prescriptions of ADDERALL XR. Should CMS take such an approach,the Group could seek to limit any additional payments to a level approximating the full, un-rebated cost to the States of ADDERALL XR, or $98 millionabove the recorded liability. Further, the Group believes it has a strong legal basis supporting its interpretation of the Medicaid rebate legislation, andthat there would be a strong basis to initiate litigation to recover any amount paid in excess of its recorded liability. The result of any such litigationcannot be predicted and could result in additional rebate liability above the Group’s current best estimate.LIALDA/MEZAVANT—Ulcerative colitisStrong product sales of LIALDA/MEZAVANT continued in the year to December 31, 2009 driven by an increase in market share over 2008, growthin the US oral mesalamine market and price increases taken during 2009.PENTASA—Ulcerative colitisProduct sales of PENTASA continued to grow despite a decrease in US prescription demand in 2009 compared to 2008 due to the impact of priceincreases taken during 2009.FOSRENOL—HyperphosphatemiaProduct sales increased as FOSRENOL entered new countries and grew in existing markets outside the US. In the US, FOSRENOL sales grew despitelower prescriptions due to a price increase in 2009. Litigation proceedings regarding <strong>Shire</strong>’s FOSRENOL patents are ongoing. Further information aboutthis litigation can be found in Note 24 to the consolidated financial statements.


