Corral Petroleum Holdings AB (publ) Business Update ... - Preem
Corral Petroleum Holdings AB (publ) Business Update ... - Preem
Corral Petroleum Holdings AB (publ) Business Update ... - Preem
Create successful ePaper yourself
Turn your PDF publications into a flip-book with our unique Google optimized e-Paper software.
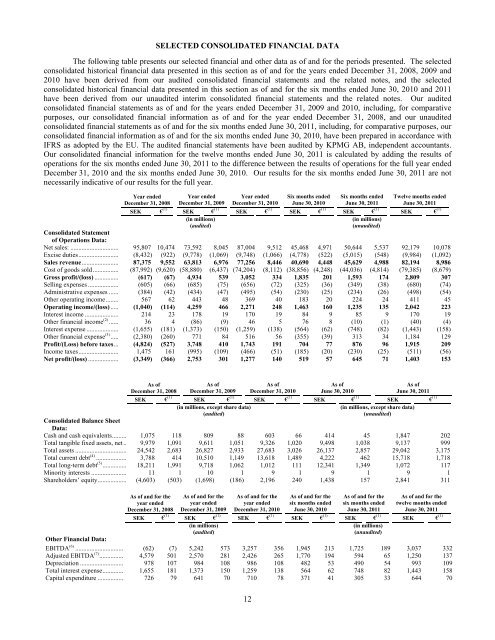
SELECTED CONSOLIDATED FINANCIAL DATAThe following table presents our selected financial and other data as of and for the periods presented. The selectedconsolidated historical financial data presented in this section as of and for the years ended December 31, 2008, 2009 and2010 have been derived from our audited consolidated financial statements and the related notes, and the selectedconsolidated historical financial data presented in this section as of and for the six months ended June 30, 2010 and 2011have been derived from our unaudited interim consolidated financial statements and the related notes. Our auditedconsolidated financial statements as of and for the years ended December 31, 2009 and 2010, including, for comparativepurposes, our consolidated financial information as of and for the year ended December 31, 2008, and our unauditedconsolidated financial statements as of and for the six months ended June 30, 2011, including, for comparative purposes, ourconsolidated financial information as of and for the six months ended June 30, 2010, have been prepared in accordance withIFRS as adopted by the EU. The audited financial statements have been audited by KPMG <strong>AB</strong>, independent accountants.Our consolidated financial information for the twelve months ended June 30, 2011 is calculated by adding the results ofoperations for the six months ended June 30, 2011 to the difference between the results of operations for the full year endedDecember 31, 2010 and the six months ended June 30, 2010. Our results for the six months ended June 30, 2011 are notnecessarily indicative of our results for the full year.Year endedDecember 31, 2008Year endedDecember 31, 2009Year endedDecember 31, 2010Six months endedJune 30, 2010Six months endedJune 30, 2011Twelve months endedJune 30, 2011SEK € (1) SEK € (1) SEK € (1) SEK € (1) SEK € (1) SEK € (1)(in millions)(audited)(in millions)(unaudited)Consolidated Statementof Operations Data:Net sales: ............................... 95,807 10,474 73,592 8,045 87,004 9,512 45,468 4,971 50,644 5,537 92,179 10,078Excise duties.......................... (8,432) (922) (9,778) (1,069) (9,748) (1,066) (4,778) (522) (5,015) (548) (9,984) (1,092)Sales revenue........................ 87,375 9,552 63,813 6,976 77,256 8,446 40,690 4,448 45,629 4,988 82,194 8,986Cost of goods sold ................. (87,992) (9,620) (58,880) (6,437) (74,204) (8,112) (38,856) (4,248) (44,036) (4,814) (79,385) (8,679)Gross profit/(loss) ................ (617) (67) 4,934 539 3,052 334 1,835 201 1,593 174 2,809 307Selling expenses .................... (605) (66) (685) (75) (656) (72) (325) (36) (349) (38) (680) (74)Administrative expenses ....... (384) (42) (434) (47) (495) (54) (230) (25) (234) (26) (498) (54)Other operating income......... 567 62 443 48 369 40 183 20 224 24 411 45Operating income/(loss) ...... (1,040) (114) 4,259 466 2,271 248 1,463 160 1,235 135 2,042 223Interest income ...................... 214 23 178 19 170 19 84 9 85 9 170 19Other financial income (2) ....... 36 4 (86) (9) 46 5 76 8 (10) (1) (40) (4)Interest expense ..................... (1,655) (181) (1,373) (150) (1,259) (138) (564) (62) (748) (82) (1,443) (158)Other financial expense (3) ...... (2,380) (260) 771 84 516 56 (355) (39) 313 34 1,184 129Profit/(Loss) before taxes.... (4,824) (527) 3,748 410 1,743 191 704 77 876 96 1,915 209Income taxes.......................... 1,475 161 (995) (109) (466) (51) (185) (20) (230) (25) (511) (56)Net profit/(loss) .................... (3,349) (366) 2,753 301 1,277 140 519 57 645 71 1,403 153As ofDecember 31, 2008As ofDecember 31, 2009As ofDecember 31, 2010As ofJune 30, 2010As ofJune 30, 2011SEK € (1) SEK € (1) SEK € (1) SEK € (1) SEK € (1)(in millions, except share data)(audited)(in millions, except share data)(unaudited)Consolidated Balance SheetData:Cash and cash equivalents......... 1,075 118 809 88 603 66 414 45 1,847 202Total tangible fixed assets, net.. 9,979 1,091 9,611 1,051 9,326 1,020 9,498 1,038 9,137 999Total assets ................................ 24,542 2,683 26,827 2,933 27,683 3,026 26,137 2,857 29,042 3,175Total current debt (4) ................... 3,788 414 10,510 1,149 13,618 1,489 4,222 462 15,718 1,718Total long-term debt (5) ............... 18,211 1,991 9,718 1,062 1,012 111 12,341 1,349 1,072 117Minority interests ...................... 11 1 10 1 9 1 9 1 9 1Shareholders’ equity.................. (4,603) (503) (1,698) (186) 2,196 240 1,438 157 2,841 311As of and for theyear endedDecember 31, 2008As of and for theyear endedDecember 31, 2009As of and for theyear endedDecember 31, 2010As of and for thesix months endedJune 30, 2010As of and for thesix months endedJune 30, 2011As of and for thetwelve months endedJune 30, 2011SEK € (1) SEK € (1) SEK € (1) SEK € (1) SEK € (1) SEK € (1)(in millions)(audited)(in millions)(unaudited)Other Financial Data:EBITDA (6) .............................. (62) (7) 5,242 573 3,257 356 1,945 213 1,725 189 3,037 332Adjusted EBITDA (7) ............... 4,579 501 2,570 281 2,426 265 1,770 194 594 65 1,250 137Depreciation ........................... 978 107 984 108 986 108 482 53 490 54 993 109Total interest expense............. 1,655 181 1,373 150 1,259 138 564 62 748 82 1,443 158Capital expenditure ................ 726 79 641 70 710 78 371 41 305 33 644 7012


