Corral Petroleum Holdings AB (publ) Business Update ... - Preem
Corral Petroleum Holdings AB (publ) Business Update ... - Preem
Corral Petroleum Holdings AB (publ) Business Update ... - Preem

You also want an ePaper? Increase the reach of your titles
YUMPU automatically turns print PDFs into web optimized ePapers that Google loves.
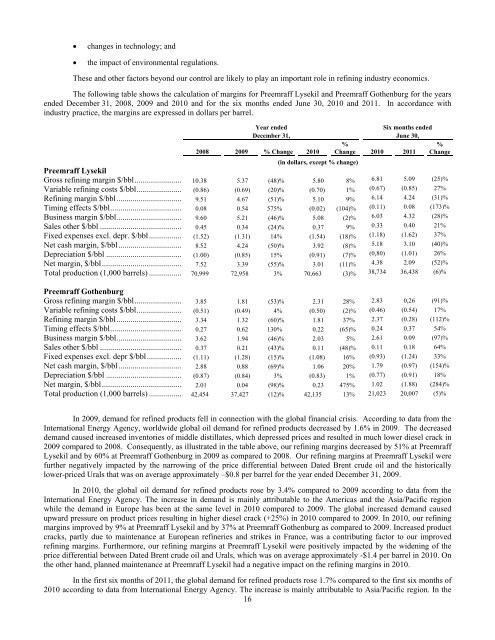
changes in technology; andthe impact of environmental regulations.These and other factors beyond our control are likely to play an important role in refining industry economics.The following table shows the calculation of margins for <strong>Preem</strong>raff Lysekil and <strong>Preem</strong>raff Gothenburg for the yearsended December 31, 2008, 2009 and 2010 and for the six months ended June 30, 2010 and 2011. In accordance withindustry practice, the margins are expressed in dollars per barrel.Year endedDecember 31,2008 2009 % Change 2010(in dollars, except % change)Six months endedJune 30,%Change 2010 2011%Change<strong>Preem</strong>raff LysekilGross refining margin $/bbl....................... 10.38 5.37 (48)% 5.80 8% 6.81 5.09 (25)%Variable refining costs $/bbl...................... (0.86) (0.69) (20)% (0.70) 1% (0.67) (0.85) 27%Refining margin $/bbl................................ 9.51 4.67 (51)% 5.10 9% 6.14 4.24 (31)%Timing effects $/bbl................................... 0.08 0.54 575% (0.02) (104)% (0.11) 0.08 (173)%<strong>Business</strong> margin $/bbl................................ 9.60 5.21 (46)% 5.08 (2)% 6.03 4.32 (28)%Sales other $/bbl ........................................ 0.45 0.34 (24)% 0.37 9% 0.33 0.40 21%Fixed expenses excl. depr. $/bbl................ (1.52) (1.31) 14% (1.54) (18)% (1.18) (1.62) 37%Net cash margin, $/bbl............................... 8.52 4.24 (50)% 3.92 (8)% 5.18 3.10 (40)%Depreciation $/bbl ..................................... (1.00) (0.85) 15% (0.91) (7)% (0,80) (1.01) 26%Net margin, $/bbl....................................... 7.52 3.39 (55)% 3.01 (11)% 4.38 2.09 (52)%Total production (1,000 barrels) ................ 70,999 72,958 3% 70,663 (3)% 38,734 36,438 (6)%<strong>Preem</strong>raff GothenburgGross refining margin $/bbl....................... 3.85 1.81 (53)% 2.31 28% 2.83 0,26 (91)%Variable refining costs $/bbl...................... (0.51) (0.49) 4% (0.50) (2)% (0.46) (0.54) 17%Refining margin $/bbl................................ 3.34 1.32 (60)% 1.81 37% 2.37 (0.28) (112)%Timing effects $/bbl................................... 0.27 0.62 130% 0.22 (65)% 0.24 0.37 54%<strong>Business</strong> margin $/bbl................................ 3.62 1.94 (46)% 2.03 5% 2.61 0.09 (97)%Sales other $/bbl ........................................ 0.37 0.21 (43)% 0.11 (48)% 0.11 0.18 64%Fixed expenses excl. depr $/bbl................. (1.11) (1.28) (15)% (1.08) 16% (0.93) (1.24) 33%Net cash margin, $/bbl............................... 2.88 0.88 (69)% 1.06 20% 1.79 (0.97) (154)%Depreciation $/bbl ..................................... (0.87) (0.84) 3% (0.83) 1% (0.77) (0.91) 18%Net margin, $/bbl....................................... 2.01 0.04 (98)% 0.23 475% 1.02 (1.88) (284)%Total production (1,000 barrels) ................ 42,454 37,427 (12)% 42,135 13% 21,023 20,007 (5)%In 2009, demand for refined products fell in connection with the global financial crisis. According to data from theInternational Energy Agency, worldwide global oil demand for refined products decreased by 1.6% in 2009. The decreaseddemand caused increased inventories of middle distillates, which depressed prices and resulted in much lower diesel crack in2009 compared to 2008. Consequently, as illustrated in the table above, our refining margins decreased by 51% at <strong>Preem</strong>raffLysekil and by 60% at <strong>Preem</strong>raff Gothenburg in 2009 as compared to 2008. Our refining margins at <strong>Preem</strong>raff Lysekil werefurther negatively impacted by the narrowing of the price differential between Dated Brent crude oil and the historicallylower-priced Urals that was on average approximately –$0.8 per barrel for the year ended December 31, 2009.In 2010, the global oil demand for refined products rose by 3.4% compared to 2009 according to data from theInternational Energy Agency. The increase in demand is mainly attributable to the Americas and the Asia/Pacific regionwhile the demand in Europe has been at the same level in 2010 compared to 2009. The global increased demand causedupward pressure on product prices resulting in higher diesel crack (+25%) in 2010 compared to 2009. In 2010, our refiningmargins improved by 9% at <strong>Preem</strong>raff Lysekil and by 37% at <strong>Preem</strong>raff Gothenburg as compared to 2009. Increased productcracks, partly due to maintenance at European refineries and strikes in France, was a contributing factor to our improvedrefining margins. Furthermore, our refining margins at <strong>Preem</strong>raff Lysekil were positively impacted by the widening of theprice differential between Dated Brent crude oil and Urals, which was on average approximately -$1.4 per barrel in 2010. Onthe other hand, planned maintenance at <strong>Preem</strong>raff Lysekil had a negative impact on the refining margins in 2010.In the first six months of 2011, the global demand for refined products rose 1.7% compared to the first six months of2010 according to data from International Energy Agency. The increase is mainly attributable to Asia/Pacific region. In the16