Corral Petroleum Holdings AB (publ) Business Update ... - Preem
Corral Petroleum Holdings AB (publ) Business Update ... - Preem
Corral Petroleum Holdings AB (publ) Business Update ... - Preem
Create successful ePaper yourself
Turn your PDF publications into a flip-book with our unique Google optimized e-Paper software.
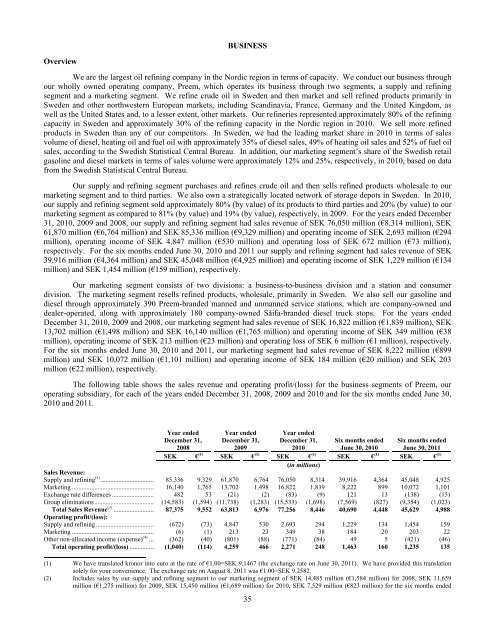
BUSINESSOverviewWe are the largest oil refining company in the Nordic region in terms of capacity. We conduct our business throughour wholly owned operating company, <strong>Preem</strong>, which operates its business through two segments, a supply and refiningsegment and a marketing segment. We refine crude oil in Sweden and then market and sell refined products primarily inSweden and other northwestern European markets, including Scandinavia, France, Germany and the United Kingdom, aswell as the United States and, to a lesser extent, other markets. Our refineries represented approximately 80% of the refiningcapacity in Sweden and approximately 30% of the refining capacity in the Nordic region in 2010. We sell more refinedproducts in Sweden than any of our competitors. In Sweden, we had the leading market share in 2010 in terms of salesvolume of diesel, heating oil and fuel oil with approximately 35% of diesel sales, 49% of heating oil sales and 52% of fuel oilsales, according to the Swedish Statistical Central Bureau. In addition, our marketing segment’s share of the Swedish retailgasoline and diesel markets in terms of sales volume were approximately 12% and 25%, respectively, in 2010, based on datafrom the Swedish Statistical Central Bureau.Our supply and refining segment purchases and refines crude oil and then sells refined products wholesale to ourmarketing segment and to third parties. We also own a strategically located network of storage depots in Sweden. In 2010,our supply and refining segment sold approximately 80% (by value) of its products to third parties and 20% (by value) to ourmarketing segment as compared to 81% (by value) and 19% (by value), respectively, in 2009. For the years ended December31, 2010, 2009 and 2008, our supply and refining segment had sales revenue of SEK 76,050 million (€8,314 million), SEK61,870 million (€6,764 million) and SEK 85,336 million (€9,329 million) and operating income of SEK 2,693 million (€294million), operating income of SEK 4,847 million (€530 million) and operating loss of SEK 672 million (€73 million),respectively. For the six months ended June 30, 2010 and 2011 our supply and refining segment had sales revenue of SEK39,916 million (€4,364 million) and SEK 45,048 million (€4,925 million) and operating income of SEK 1,229 million (€134million) and SEK 1,454 million (€159 million), respectively.Our marketing segment consists of two divisions: a business-to-business division and a station and consumerdivision. The marketing segment resells refined products, wholesale, primarily in Sweden. We also sell our gasoline anddiesel through approximately 390 <strong>Preem</strong>-branded manned and unmanned service stations, which are company-owned anddealer-operated, along with approximately 180 company-owned Såifa-branded diesel truck stops. For the years endedDecember 31, 2010, 2009 and 2008, our marketing segment had sales revenue of SEK 16,822 million (€1,839 million), SEK13,702 million (€1,498 million) and SEK 16,140 million (€1,765 million) and operating income of SEK 349 million (€38million), operating income of SEK 213 million (€23 million) and operating loss of SEK 6 million (€1 million), respectively.For the six months ended June 30, 2010 and 2011, our marketing segment had sales revenue of SEK 8,222 million (€899million) and SEK 10,072 million (€1,101 million) and operating income of SEK 184 million (€20 million) and SEK 203million (€22 million), respectively.The following table shows the sales revenue and operating profit/(loss) for the business segments of <strong>Preem</strong>, ouroperating subsidiary, for each of the years ended December 31, 2008, 2009 and 2010 and for the six months ended June 30,2010 and 2011.Year endedDecember 31,2008Year endedDecember 31,200935Year endedDecember 31,2010Six months endedJune 30, 2010Six months endedJune 30, 2011SEK € (1) SEK € (1) SEK € (1) SEK € (1) SEK € (1)(in millions)Sales Revenue:Supply and refining (2) .................................. 85,336 9,329 61,870 6,764 76,050 8,314 39,916 4,364 45,048 4,925Marketing .................................................... 16,140 1,765 13,702 1,498 16,822 1,839 8,222 899 10,072 1,101Exchange rate differences ........................... 482 53 (21) (2) (83) (9) 121 13 (138) (15)Group eliminations...................................... (14,583) (1,594) (11,738) (1,283) (15,533) (1,698) (7,569) (827) (9,354) (1,023)Total Sales Revenue (3) .......................... 87,375 9,552 63,813 6,976 77,256 8,446 40,690 4,448 45,629 4,988Operating profit/(loss):Supply and refining ..................................... (672) (73) 4,847 530 2,693 294 1,229 134 1,454 159Marketing .................................................... (6) (1) 213 23 349 38 184 20 203 22Other non-allocated income (expense) (4) .... (362) (40) (801) (88) (771) (84) 49 5 (421) (46)Total operating profit/(loss) ................ (1,040) (114) 4,259 466 2,271 248 1,463 160 1,235 135(1) We have translated kronor into euro at the rate of €1.00=SEK 9.1467 (the exchange rate on June 30, 2011). We have provided this translationsolely for your convenience. The exchange rate on August 8, 2011 was €1.00=SEK 9.2582.(2) Includes sales by our supply and refining segment to our marketing segment of SEK 14,485 million (€1,584 million) for 2008, SEK 11,659million (€1,275 million) for 2009, SEK 15,450 million (€1,689 million) for 2010, SEK 7,529 million (€823 million) for the six months ended


