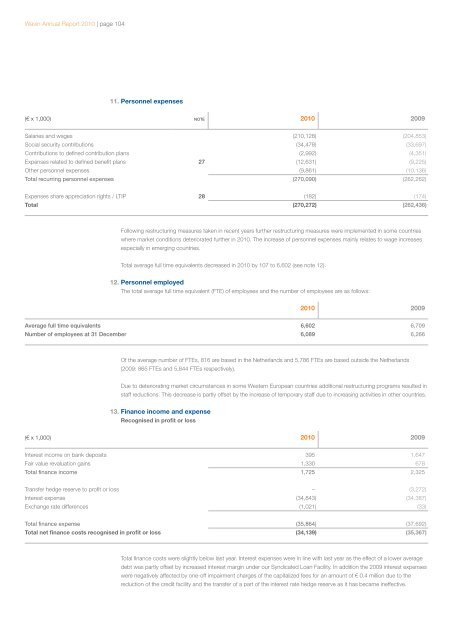
<strong>Wavin</strong> Annual Report 2010 | page 10411. Personnel expenses(€ x 1,000) NOTE 2010 2009Salaries and wages (210,128) (204,853)Social security contributions (34,478) (33,697)Contributions to defi ned contribution plans (2,992) (4,351)Expenses related to defi ned benefi t plans 27 (12,631) (9,225)Other personnel expenses (9,861) (10,136)Total recurring personnel expenses (270,090) (262,262)Expenses share appreciation rights / LTIP 28 (182) (174)Total (270,272) (262,436)Following restructuring measures taken in recent years further restructuring measures were implemented in some countrieswhere market conditions deteriorated further in 2010. The increase of personnel expenses mainly relates to wage increasesespecially in emerging countries.Total average full time equivalents decreased in 2010 by 107 to 6,602 (see note 12).12. Personnel employedThe total average full time equivalent (FTE) of employees and the number of employees are as follows:2010 2009Average full time equivalents 6,602 6,709Number of employees at 31 December 6,089 6,266Of the average number of FTEs, 816 are based in the Netherlands and 5,786 FTEs are based outside the Netherlands(2009: 865 FTEs and 5,844 FTEs respectively).Due to deteriorating market circumstances in some Western European countries additional restructuring programs resulted instaff reductions. This decrease is partly offset by the increase of temporary staff due to increasing activities in other countries.13. Finance in<strong>com</strong>e and expenseRecognised in profit or loss(€ x 1,000) 2010 2009Interest in<strong>com</strong>e on bank deposits 395 1,647Fair value revaluation gains 1,330 678Total finance in<strong>com</strong>e 1,725 2,325Transfer hedge reserve to profi t or loss – (3,272)Interest expense (34,843) (34,387)Exchange rate differences (1,021) (33)Total finance expense (35,864) (37,692)Total net finance costs recognised in profit or loss (34,139) (35,367)Total fi nance costs were slightly below last year. Interest expenses were in line with last year as the effect of a lower averagedebt was partly offset by increased interest margin under our Syndicated Loan Facility. In addition the 2009 interest expenseswere negatively affected by one-off impairment charges of the capitalized fees for an amount of € 0.4 million due to thereduction of the credit facility and the transfer of a part of the interest rate hedge reserve as it has became ineffective.
<strong>Wavin</strong> Annual Report 2010 | page 105In November 2010 the interest margin on the syndicated loan facilities were reduced. The amendment was realised with fullconsent of the syndicate of lending banks. The € 500 million Syndicated Loan Facility (maturing October 2011) and the€ 475 million Forward Start Facility (starting October 2011, maturing April 2013) remained in place. The benefi ts of the revisedmargin have be<strong>com</strong>e effective as of 24 November 2010.As a result of the recapitalisation in 2009 the level of outstanding interest instruments exceeded the drawings under theAmended Credit Facility and have be<strong>com</strong>e ineffective. Per 31 December 2010 the fair value of the outstanding ineffectivehedge instruments was € 1.4 million (31 December 2009: € 2.7 million). The change in fair value of these instruments isrecorded through the in<strong>com</strong>e statement instead of equity, resulting in a profi t of € 1.3 million (2009: € 0.6 million).Recognised in other <strong>com</strong>prehensive in<strong>com</strong>e(€ x 1,000) 2010 2009Fair value changes fi nancial instruments 2,014 (5,224)Transfer hedge reserve to profi t or loss – 3,272In<strong>com</strong>e tax on fi nance in<strong>com</strong>e (expense) recognised in other<strong>com</strong>prehensive in<strong>com</strong>e (485) 495Total net finance costs recognised in <strong>com</strong>prehensive in<strong>com</strong>e 1,529 1,45714. Non-recurring in<strong>com</strong>e and expense(€ x 1,000) NOTE 2010 2009Restructuring costs 29 (6,814) (18,078)Profi t on sale of property, plant & equipment 9 860 2,020Curtailment gain 27 – 1,378Acquisition costs (221) –Share-based payments 28 – (51)Other (205) 90Total non-recurring results from operating activities (6,380) (14,641)Tax rate adjustments 15 1,244 16Non-recurring tax benefi ts 3,372 4,700Total non-recurring in<strong>com</strong>e tax 4,616 4,716Total (1,764) (9,925)Restructuring costs in 2010 relate to announced restructurings in 2010 in the Netherlands, Germany, Belgium and Francenext to some smaller programmes throughout the Group.The profi t on sale of property, plant & equipment includes the profi t on the sale of redundant buildings and installations inBelgium, France and the Netherlands which were classifi ed as held-for-sale per 31 December 2009 (see note 9) and the losson disposed property, plant and equipment due to the closure of a production facility in the UK following the restructuringmeasures.The acquisition costs represent expenses made for the acquisition of KWH in Sweden (see note 38) and the establishment ofthe sales organisation with Gebr. Ostendorf – OSMA zpracováni plastu (see note 7).Non-recurring tax benefi ts include the tax effect on non-recurring in<strong>com</strong>e and expense, liquidation losses related to theclosure of foreign operations and the effect on the deferred tax position of the reduction of the corporate in<strong>com</strong>e tax rate inthe Netherlands from 25.5% to 25.0% as per January 2011 (see note 15).