
Create successful ePaper yourself
Turn your PDF publications into a flip-book with our unique Google optimized e-Paper software.
SHARES AND SHAREHOLDERS<br />
Incentive programmes<br />
Share-based option programmes<br />
In 2005, <strong>Stora</strong> <strong>Enso</strong> extended the two<br />
share-based option programmes introduced<br />
in 2004 to cover all participants in<br />
long-term incentive plans. The programmes<br />
are synthetic share awards<br />
under which designated employees may<br />
receive shares already issued (not new<br />
shares).<br />
Option/synthetic option programmes<br />
<strong>Stora</strong> <strong>Enso</strong> has seven option/synthetic<br />
option programmes for key personnel.<br />
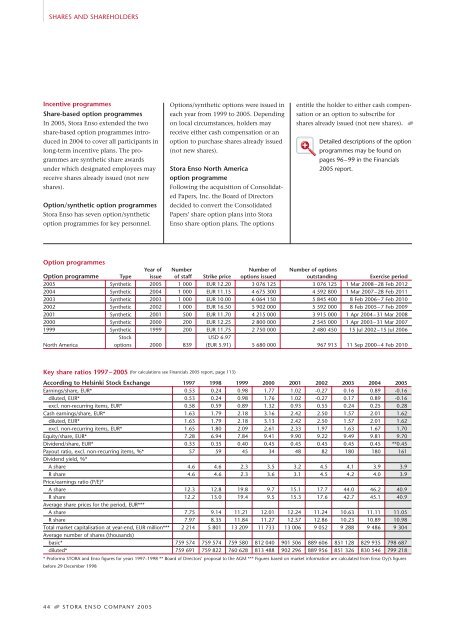
Option programmes<br />
Option programme Type<br />
44• STORA ENSO COMPANY 2005<br />
Year of<br />
issue<br />
Options/synthetic options were issued in<br />
each year from 1999 to 2005. Depending<br />
on local circumstances, holders may<br />
receive either cash compensation or an<br />
option to purchase shares already issued<br />
(not new shares).<br />
<strong>Stora</strong> <strong>Enso</strong> North America<br />
option programme<br />
Following the acquisition of Consolidated<br />
Papers, Inc. the Board of Directors<br />
decided to convert the Consolidated<br />
Papers’ share option plans into <strong>Stora</strong><br />
<strong>Enso</strong> share option plans. The options<br />
Number<br />
of staff Strike price<br />
Number of<br />
options issued<br />
entitle the holder to either cash compensation<br />
or an option to subscribe for<br />
shares already issued (not new shares). •<br />
Number of options<br />
outstanding Exercise period<br />
2005 Synthetic 2005 1 000 EUR 12.20 3 076 125 3 076 125 1 Mar 2008 – 28 Feb 2012<br />
2004 Synthetic 2004 1 000 EUR 11.15 4 675 300 4 592 800 1 Mar 2007 – 28 Feb 2011<br />
2003 Synthetic 2003 1 000 EUR 10.00 6 064 150 5 845 400 8 Feb 2006 – 7 Feb 2010<br />
2002 Synthetic 2002 1 000 EUR 16.50 5 902 000 5 592 000 8 Feb 2005 – 7 Feb 2009<br />
2001 Synthetic 2001 500 EUR 11.70 4 215 000 3 915 000 1 Apr 2004 – 31 Mar 2008<br />
2000 Synthetic 2000 200 EUR 12.25 2 800 000 2 545 000 1 Apr 2003 – 31 Mar 2007<br />
1999 Synthetic 1999 200 EUR 11.75 2 750 000 2 480 450 15 Jul 2002 – 15 Jul 2006<br />
North America<br />
Stock<br />
options 2000 839<br />
Detailed descriptions of the option<br />
programmes may be found on<br />
pages 96 – 99 in the Financials<br />
2005 report.<br />
USD 6.97<br />
(EUR 5.91) 5 680 000 967 913 11 Sep 2000 – 4 Feb 2010<br />
Key share ratios 1997 – 2005 (for calculations see Financials 2005 report, page 113)<br />
According to Helsinki Stock Exchange 1997 1998 1999 2000 2001 2002 2003 2004 2005<br />
Earnings/share, EUR* 0.53 0.24 0.98 1.77 1.02 -0.27 0.16 0.89 -0.16<br />
diluted, EUR* 0.53 0.24 0.98 1.76 1.02 -0.27 0.17 0.89 -0.16<br />
excl. non-recurring items, EUR* 0.58 0.59 0.89 1.32 0.93 0.55 0.24 0.25 0.28<br />
Cash earnings/share, EUR* 1.63 1.79 2.18 3.16 2.42 2.50 1.57 2.01 1.62<br />
diluted, EUR* 1.63 1.79 2.18 3.13 2.42 2.50 1.57 2.01 1.62<br />
excl. non-recurring items, EUR* 1.65 1.80 2.09 2.61 2.33 1.97 1.63 1.67 1.70<br />
Equity/share, EUR* 7.28 6.94 7.84 9.41 9.90 9.22 9.49 9.81 9.70<br />
Dividend/share, EUR* 0.33 0.35 0.40 0.45 0.45 0.45 0.45 0.45 **0.45<br />
Payout ratio, excl. non-recurring items, %*<br />
Dividend yield, %*<br />
57 59 45 34 48 82 180 180 161<br />
A share 4.6 4.6 2.3 3.5 3.2 4.5 4.1 3.9 3.9<br />
R share<br />
Price/earnings ratio (P/E)*<br />
4.6 4.6 2.3 3.6 3.1 4.5 4.2 4.0 3.9<br />
A share 12.3 12.8 19.8 9.7 15.1 17.7 44.0 46.2 40.9<br />
R share<br />
Average share prices for the period, EUR***<br />
12.2 13.0 19.4 9.5 15.3 17.6 42.7 45.1 40.9<br />
A share 7.75 9.14 11.21 12.01 12.24 11.24 10.63 11.11 11.05<br />
R share 7.97 8.35 11.84 11.27 12.57 12.86 10.23 10.89 10.98<br />
Total market capitalisation at year-end, EUR million***<br />
Average number of shares (thousands)<br />
2 214 5 801 13 209 11 733 13 006 9 052 9 288 9 486 9 304<br />
basic* 759 574 759 574 759 580 812 040 901 506 889 606 851 128 829 935 798 687<br />
diluted* 759 691 759 822 760 628 813 488 902 296 889 956 851 326 830 546 799 218<br />
* Proforma STORA and <strong>Enso</strong> figures for years 1997–1998 ** Board of Directors’ proposal to the AGM *** Figures based on market information are calculated from <strong>Enso</strong> Oyj’s figures<br />
before 29 December 1998