
Create successful ePaper yourself
Turn your PDF publications into a flip-book with our unique Google optimized e-Paper software.
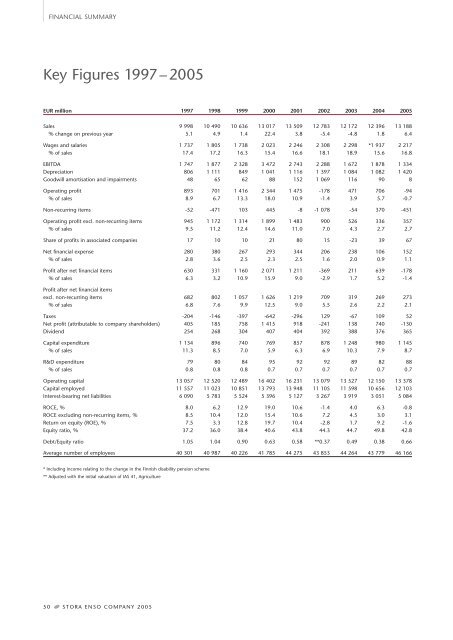
FINANCIAL SUMMARY<br />
Key Figures 1997 – 2005<br />
EUR million 1997 1998 1999 2000 2001 2002 2003 2004 2005<br />
Sales 9 998 10 490 10 636 13 017 13 509 12 783 12 172 12 396 13 188<br />
% change on previous year 5.1 4.9 1.4 22.4 3.8 -5.4 -4.8 1.8 6.4<br />
Wages and salaries 1 737 1 805 1 738 2 023 2 246 2 308 2 298 *1 937 2 217<br />
% of sales 17.4 17.2 16.3 15.4 16.6 18.1 18.9 15.6 16.8<br />
EBITDA 1 747 1 877 2 328 3 472 2 743 2 288 1 672 1 878 1 334<br />
Depreciation 806 1 111 849 1 041 1 116 1 397 1 084 1 082 1 420<br />
Goodwill amortisation and impairments 48 65 62 88 152 1 069 116 90 8<br />
Operating profit 893 701 1 416 2 344 1 475 -178 471 706 -94<br />
% of sales 8.9 6.7 13.3 18.0 10.9 -1.4 3.9 5.7 -0.7<br />
Non-recurring items -52 -471 103 445 -8 -1 078 -54 370 -451<br />
Operating profit excl. non-recurring items 945 1 172 1 314 1 899 1 483 900 526 336 357<br />
% of sales 9.5 11.2 12.4 14.6 11.0 7.0 4.3 2.7 2.7<br />
Share of profits in associated companies 17 10 10 21 80 15 -23 39 67<br />
Net financial expense 280 380 267 293 344 206 238 106 152<br />
% of sales 2.8 3.6 2.5 2.3 2.5 1.6 2.0 0.9 1.1<br />
Profit after net financial items 630 331 1 160 2 071 1 211 -369 211 639 -178<br />
% of sales 6.3 3.2 10.9 15.9 9.0 -2.9 1.7 5.2 -1.4<br />
Profit after net financial items<br />
excl. non-recurring items 682 802 1 057 1 626 1 219 709 319 269 273<br />
% of sales 6.8 7.6 9.9 12.5 9.0 5.5 2.6 2.2 2.1<br />
Taxes -204 -146 -397 -642 -296 129 -67 109 52<br />
Net profit (attributable to company shareholders) 405 185 758 1 415 918 -241 138 740 -130<br />
Dividend 254 268 304 407 404 392 388 376 365<br />
Capital expenditure 1 134 896 740 769 857 878 1 248 980 1 145<br />
% of sales 11.3 8.5 7.0 5.9 6.3 6.9 10.3 7.9 8.7<br />
R&D expenditure 79 80 84 95 92 92 89 82 88<br />
% of sales 0.8 0.8 0.8 0.7 0.7 0.7 0.7 0.7 0.7<br />
Operating capital 13 057 12 520 12 489 16 402 16 231 13 079 13 527 12 150 13 378<br />
Capital employed 11 557 11 023 10 851 13 793 13 948 11 105 11 598 10 656 12 103<br />
Interest-bearing net liabilities 6 090 5 783 5 524 5 396 5 127 3 267 3 919 3 051 5 084<br />
ROCE, % 8.0 6.2 12.9 19.0 10.6 -1.4 4.0 6.3 -0.8<br />
ROCE excluding non-recurring items, % 8.5 10.4 12.0 15.4 10.6 7.2 4.5 3.0 3.1<br />
Return on equity (ROE), % 7.5 3.3 12.8 19.7 10.4 -2.8 1.7 9.2 -1.6<br />
Equity ratio, % 37.2 36.0 38.4 40.6 43.8 44.3 44.7 49.8 42.8<br />
Debt/Equity ratio 1.05 1.04 0.90 0.63 0.58 **0.37 0.49 0.38 0.66<br />
Average number of employees 40 301 40 987 40 226 41 785 44 275 43 853 44 264 43 779 46 166<br />
* Including income relating to the change in the Finnish disability pension scheme<br />
** Adjusted with the initial valuation of IAS 41, Agriculture<br />
50• STORA ENSO COMPANY 2005