Download - Globe
Download - Globe
Download - Globe
- No tags were found...

You also want an ePaper? Increase the reach of your titles
YUMPU automatically turns print PDFs into web optimized ePapers that Google loves.
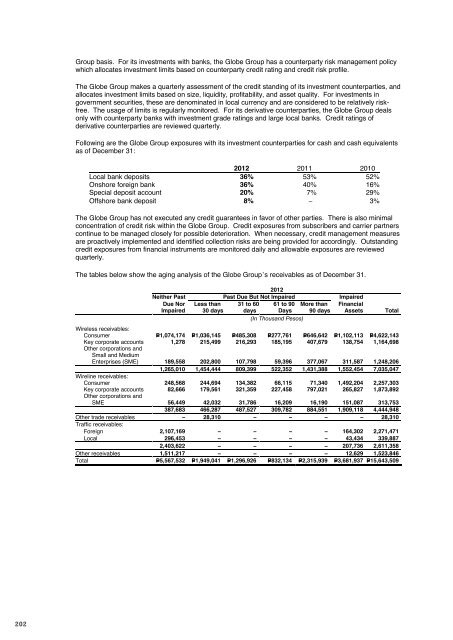
<strong>Globe</strong> 2012 annual reportfinancial reportGroup basis. For its investments with banks, the <strong>Globe</strong> Group has a counterparty risk management policywhich allocates investment limits based on counterparty credit rating and credit risk profile.The <strong>Globe</strong> Group makes a quarterly assessment of the credit standing of its investment counterparties, andallocates investment limits based on size, liquidity, profitability, and asset quality. For investments ingovernment securities, these are denominated in local currency and are considered to be relatively riskfree.The usage of limits is regularly monitored. For its derivative counterparties, the <strong>Globe</strong> Group dealsonly with counterparty banks with investment grade ratings and large local banks. Credit ratings ofderivative counterparties are reviewed quarterly.Following are the <strong>Globe</strong> Group exposures with its investment counterparties for cash and cash equivalentsas of December 31:2012 2011 2010Local bank deposits 36% 53% 52%Onshore foreign bank 36% 40% 16%Special deposit account 20% 7% 29%Offshore bank deposit 8% – 3%The <strong>Globe</strong> Group has not executed any credit guarantees in favor of other parties. There is also minimalconcentration of credit risk within the <strong>Globe</strong> Group. Credit exposures from subscribers and carrier partnerscontinue to be managed closely for possible deterioration. When necessary, credit management measuresare proactively implemented and identified collection risks are being provided for accordingly. Outstandingcredit exposures from financial instruments are monitored daily and allowable exposures are reviewedquarterly.The tables below show the aging analysis of the <strong>Globe</strong> Group’s receivables as of December 31.2012Neither Past Past Due But Not Impaired ImpairedDue Nor Less than 31 to 60 61 to 90 More than FinancialImpaired 30 days days Days 90 days Assets Total(In Thousand Pesos)Wireless receivables:Consumer P=1,074,174 P=1,036,145 P=485,308 P=277,761 P=646,642 P=1,102,113 P=4,622,143Key corporate accounts 1,278 215,499 216,293 185,195 407,679 138,754 1,164,698Other corporations andSmall and MediumEnterprises (SME) 189,558 202,800 107,798 59,396 377,067 311,587 1,248,2061,265,010 1,454,444 809,399 522,352 1,431,388 1,552,454 7,035,047Wireline receivables:Consumer 248,568 244,694 134,382 66,115 71,340 1,492,204 2,257,303Key corporate accounts 82,666 179,561 321,359 227,458 797,021 265,827 1,873,892Other corporations andSME 56,449 42,032 31,786 16,209 16,190 151,087 313,753387,683 466,287 487,527 309,782 884,551 1,909,118 4,444,948Other trade receivables – 28,310 – – – – 28,310Traffic receivables:Foreign 2,107,169 – – – – 164,302 2,271,471Local 296,453 – – – – 43,434 339,8872,403,622 – – – – 207,736 2,611,358Other receivables 1,511,217 – – – – 12,629 1,523,846Total P=5,567,532 P=1,949,041 P=1,296,926 P=832,134 P=2,315,939 P=3,681,937 P=15,643,5092011Neither Past Past Due But Not Impaired ImpairedDue Nor Less than 31 to 60 61 to 90 More than FinancialImpaired 30 days days Days 90 days Assets Total(In Thousand Pesos)Wireless receivables:Consumer P=668,475 P=651,816 P=381,531 P=227,761 P=538,984 P=713,729 P=3,182,296Key corporate accounts 51,246 169,990 201,517 132,861 326,724 81,418 963,756Other corporations andSME 288,812 254,929 250,509 137,686 436,163 161,668 1,529,7671,008,533 1,076,735 833,557 498,308 1,301,871 956,815 5,675,819Wireline receivables:Consumer 241,871 240,349 117,342 57,601 50,462 1,782,483 2,490,108Key corporate accounts 54,660 160,792 310,180 205,290 676,864 214,751 1,622,537Other corporations andSME 62,354 82,425 31,998 24,815 41,776 192,679 436,047358,885 483,566 459,520 287,706 769,102 2,189,913 4,548,692Other trade receivables – 3,986 1,940 5,553 9,278 – 20,757Traffic receivables:Foreign 1,890,996 – – – – 165,261 2,056,257Local 163,068 – – – – 72,537 235,6052,054,064 – – – – 237,798 2,291,862Other receivables 951,302 – – – – 11,703 963,005Total P=4,372,784 P=1,564,287 P=1,295,017 P=791,567 P=2,080,251 P=3,396,229 P=13,500,1352010Neither Past Past Due But Not Impaired ImpairedDue Nor Less than 31 to 60 61 to 90 More than FinancialImpaired 30 days days Days 90 days Assets Total(In Thousand Pesos)Wireless receivables:Consumer P=521,771 P=739,554 P=311,860 P=139,330 P=744,827 P=346,499 P=2,803,841Key corporate accounts 19,975 103,032 150,689 127,929 201,733 74,131 677,489Other corporations andSME 129,570 152,544 76,092 18,802 175,710 83,920 636,638671,316 995,130 538,641 286,061 1,122,270 504,550 4,117,968Wireline receivables:Consumer 235,480 215,510 111,297 66,806 76,989 1,252,527 1,958,609Key corporate accounts 11,998 166,530 154,248 207,756 813,507 179,015 1,533,054Other corporations andSME 77,937 66,958 41,847 24,945 58,744 140,542 410,973325,415 448,998 307,392 299,507 949,240 1,572,084 3,902,636Other trade receivables – – 8,447 5,186 4,214 17,847Traffic receivables:Foreign 1,731,708 – – – – 175,241 1,906,949Local 133,474 – – – – 89,815 223,2891,865,182 – – – – 265,056 2,130,238Other receivables 647,464 – – – – 11,414 658,878Total P=3,509,377 P=1,444,128 P=854,480 P=590,754 P=2,075,724 P=2,353,104 P=10,827,567Total allowance for impairment losses amounted to P=3,538.07 million, P=3,380.63 million and P=2,453.44million includes allowance for impairment losses arising from specific and collective assessment amountedto P=341.73 million, P=337.65 million and P=328.72 million as of December 31, 2012, 2011 and 2010,respectively (see Note 4).202 203