Download - Globe
Download - Globe
Download - Globe
- No tags were found...

You also want an ePaper? Increase the reach of your titles
YUMPU automatically turns print PDFs into web optimized ePapers that Google loves.
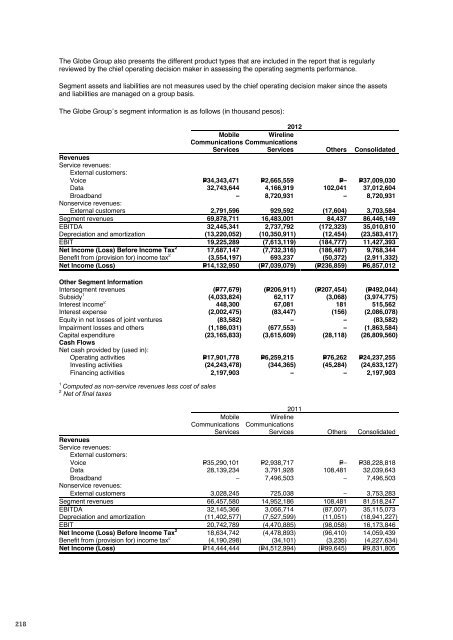
<strong>Globe</strong> 2012 annual reportfinancial reportThe <strong>Globe</strong> Group also presents the different product types that are included in the report that is regularlyreviewed by the chief operating decision maker in assessing the operating segments performance.Segment assets and liabilities are not measures used by the chief operating decision maker since the assetsand liabilities are managed on a group basis.The <strong>Globe</strong> Group’s segment information is as follows (in thousand pesos):2012Mobile WirelineCommunications CommunicationsServices Services Others ConsolidatedRevenuesService revenues:External customers:Voice P=34,343,471 P=2,665,559 P=– P=37,009,030Data 32,743,644 4,166,919 102,041 37,012,604Broadband – 8,720,931 – 8,720,931Nonservice revenues:External customers 2,791,596 929,592 (17,604) 3,703,584Segment revenues 69,878,711 16,483,001 84,437 86,446,149EBITDA 32,445,341 2,737,792 (172,323) 35,010,810Depreciation and amortization (13,220,052) (10,350,911) (12,454) (23,583,417)EBIT 19,225,289 (7,613,119) (184,777) 11,427,393Net Income (Loss) Before Income Tax 2 17,687,147 (7,732,316) (186,487) 9,768,344Benefit from (provision for) income tax 2 (3,554,197) 693,237 (50,372) (2,911,332)Net Income (Loss) P=14,132,950 (P=7,039,079) (P=236,859) P=6,857,012Other Segment InformationIntersegment revenues (P=77,679) (P=206,911) (P=207,454) (P=492,044)Subsidy 1 (4,033,824) 62,117 (3,068) (3,974,775)Interest income 2 448,300 67,081 181 515,562Interest expense (2,002,475) (83,447) (156) (2,086,078)Equity in net losses of joint ventures (83,582) – – (83,582)Impairment losses and others (1,186,031) (677,553) – (1,863,584)Capital expenditure (23,165,833) (3,615,609) (28,118) (26,809,560)Cash FlowsNet cash provided by (used in):Operating activities P=17,901,778 P=6,259,215 P=76,262 P=24,237,255Investing activities (24,243,478) (344,365) (45,284) (24,633,127)Financing activities 2,197,903 – – 2,197,9031Computed as non-service revenues less cost of sales2 Net of final taxes2011Mobile WirelineCommunications CommunicationsServices Services Others ConsolidatedRevenuesService revenues:External customers:Voice P=35,290,101 P=2,938,717 P=– P=38,228,818Data 28,139,234 3,791,928 108,481 32,039,643Broadband – 7,496,503 – 7,496,503Nonservice revenues:External customers 3,028,245 725,038 – 3,753,283Segment revenues 66,457,580 14,952,186 108,481 81,518,247EBITDA 32,145,366 3,056,714 (87,007) 35,115,073Depreciation and amortization (11,402,577) (7,527,599) (11,051) (18,941,227)EBIT 20,742,789 (4,470,885) (98,058) 16,173,846Net Income (Loss) Before Income Tax 2 18,634,742 (4,478,893) (96,410) 14,059,439Benefit from (provision for) income tax 2 (4,190,298) (34,101) (3,235) (4,227,634)Net Income (Loss) P=14,444,444 (P=4,512,994) (P=99,645) P=9,831,8052011Mobile WirelineCommunications CommunicationsServices Services Others ConsolidatedOther Segment InformationIntersegment revenues P=34,747 (P=264,929) (P=246,673) (P=476,855)Subsidy 1 (2,091,403) (42,060) (843) (2,134,306)Interest income 2 172,156 87,532 70 259,758Interest expense (1,994,371) (65,289) (2,059,660)Equity in net losses of joint ventures (27,345) – – (27,345)Impairment losses and others (1,068,597) (849,986) – (1,918,583)Capital expenditure (13,530,030) (3,777,427) (109,925) (17,417,382)Cash FlowsNet cash provided by (used in):Operating activities 23,605,233 6,114,936 206,006 29,926,175Investing activities (13,734,642) (4,345,211) (109,864) (18,189,717)Financing activities (12,520,892) – – (12,520,892)1Computed as non-service revenues less cost of sales2 Net of final taxes2010MobileCommunicationsServicesWirelineCommunicationsServices Others ConsolidatedRevenuesService revenues:External customers:Voice P=36,028,624 P=3,174,947 P=– P=39,203,571Data 24,221,919 3,487,999 80,335 27,790,253Broadband – 5,748,266 – 5,748,266Nonservice revenues:External customers 2,374,542 618,759 – 2,993,301Segment revenues 62,625,085 13,029,971 80,335 75,735,391EBITDA 31,924,609 1,719,351 (84,928) 33,559,032Depreciation and amortization (11,734,900) (6,346,429) (4,510) (18,085,839)EBIT 20,189,709 (4,627,078) (89,438) 15,473,193Net Income (Loss) Before Income Tax 2 18,768,054 (4,661,415) (89,919) 14,016,720Benefit from (provision for) income tax 2 (4,518,236) 246,150 – (4,272,086)Net Income (Loss) P=14,249,818 (P=4,415,265) (P=89,919) P=9,744,634Other Segment InformationIntersegment revenues P=35,545 (P=191,933) (P=107,080) (P=263,468)Subsidy 1 (900,760) (344,899) – (1,245,659)Interest income 2 168,300 28,666 94 197,060Interest expense (1,975,932) (5,823) (30) (1,981,785)Equity in net losses of joint ventures (2,968) – – (2,968)Impairment losses and others (820,978) (708,556) – (1,529,534)Capital expenditure (13,982,817) (5,478,589) (5,467) (19,466,873)Cash FlowsNet cash provided by (used in):Operating activities 21,802,415 5,338,255 7,707 27,148,377Investing activities (12,194,022) (4,729,510) (5,281) (16,928,813)Financing activities (10,171,150) – (859) (10,172,009)1Computed as non-service revenues less cost of sales2 Net of final taxes218 219