DAP 2009/10 Final 1 - Taranaki District Health Board
DAP 2009/10 Final 1 - Taranaki District Health Board
DAP 2009/10 Final 1 - Taranaki District Health Board

You also want an ePaper? Increase the reach of your titles
YUMPU automatically turns print PDFs into web optimized ePapers that Google loves.
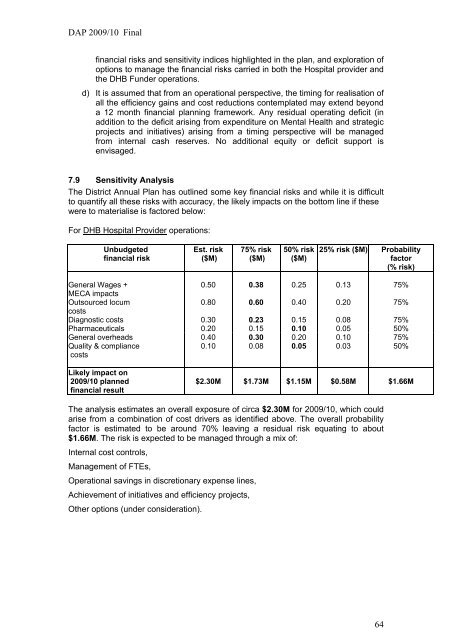
<strong>DAP</strong> <strong>2009</strong>/<strong>10</strong> <strong>Final</strong>financial risks and sensitivity indices highlighted in the plan, and exploration ofoptions to manage the financial risks carried in both the Hospital provider andthe DHB Funder operations.d) It is assumed that from an operational perspective, the timing for realisation ofall the efficiency gains and cost reductions contemplated may extend beyonda 12 month financial planning framework. Any residual operating deficit (inaddition to the deficit arising from expenditure on Mental <strong>Health</strong> and strategicprojects and initiatives) arising from a timing perspective will be managedfrom internal cash reserves. No additional equity or deficit support isenvisaged.7.9 Sensitivity AnalysisThe <strong>District</strong> Annual Plan has outlined some key financial risks and while it is difficultto quantify all these risks with accuracy, the likely impacts on the bottom line if thesewere to materialise is factored below:For DHB Hospital Provider operations:Unbudgetedfinancial riskEst. risk($M)75% risk($M)50% risk($M)25% risk ($M) Probabilityfactor(% risk)General Wages +0.50 0.38 0.25 0.13 75%MECA impactsOutsourced locum0.80 0.60 0.40 0.20 75%costsDiagnostic costs 0.30 0.23 0.15 0.08 75%Pharmaceuticals 0.20 0.15 0.<strong>10</strong> 0.05 50%General overheads 0.40 0.30 0.20 0.<strong>10</strong> 75%Quality & compliancecosts0.<strong>10</strong> 0.08 0.05 0.03 50%Likely impact on<strong>2009</strong>/<strong>10</strong> plannedfinancial result$2.30M $1.73M $1.15M $0.58M $1.66MThe analysis estimates an overall exposure of circa $2.30M for <strong>2009</strong>/<strong>10</strong>, which couldarise from a combination of cost drivers as identified above. The overall probabilityfactor is estimated to be around 70% leaving a residual risk equating to about$1.66M. The risk is expected to be managed through a mix of:Internal cost controls,Management of FTEs,Operational savings in discretionary expense lines,Achievement of initiatives and efficiency projects,Other options (under consideration).64