Commonly Used Metrics for Performance Analysis - Power.org
Commonly Used Metrics for Performance Analysis - Power.org
Commonly Used Metrics for Performance Analysis - Power.org

Create successful ePaper yourself
Turn your PDF publications into a flip-book with our unique Google optimized e-Paper software.
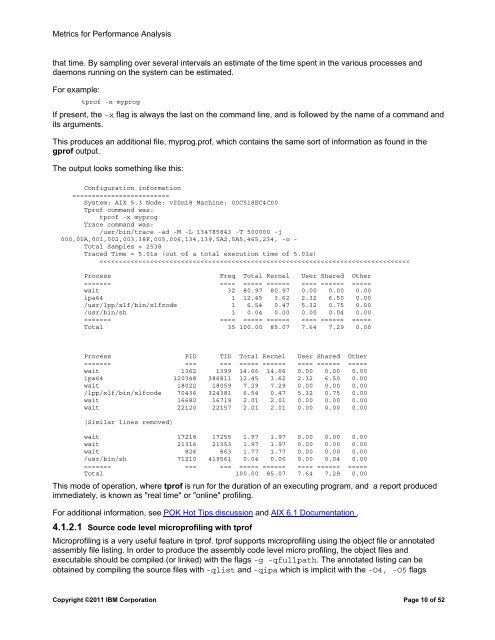
<strong>Metrics</strong> <strong>for</strong> Per<strong>for</strong>mance <strong>Analysis</strong>that time. By sampling over several intervals an estimate of the time spent in the various processes anddaemons running on the system can be estimated.For example:tprof -x myprogIf present, the -x flag is always the last on the command line, and is followed by the name of a command andits arguments.This produces an additional file, myprog.prof, which contains the same sort of in<strong>for</strong>mation as found in thegprof output.The output looks something like this:Configuration in<strong>for</strong>mation=========================System: AIX 5.3 Node: v20n18 Machine: 00C518EC4C00Tprof command was:tprof -x myprogTrace command was:/usr/bin/trace -ad -M -L 134785843 -T 500000 -j000,00A,001,002,003,38F,005,006,134,139,5A2,5A5,465,234, -o -Total Samples = 2538Traced Time = 5.01s (out of a total execution time of 5.01s)