Commonly Used Metrics for Performance Analysis - Power.org
Commonly Used Metrics for Performance Analysis - Power.org
Commonly Used Metrics for Performance Analysis - Power.org

You also want an ePaper? Increase the reach of your titles
YUMPU automatically turns print PDFs into web optimized ePapers that Google loves.
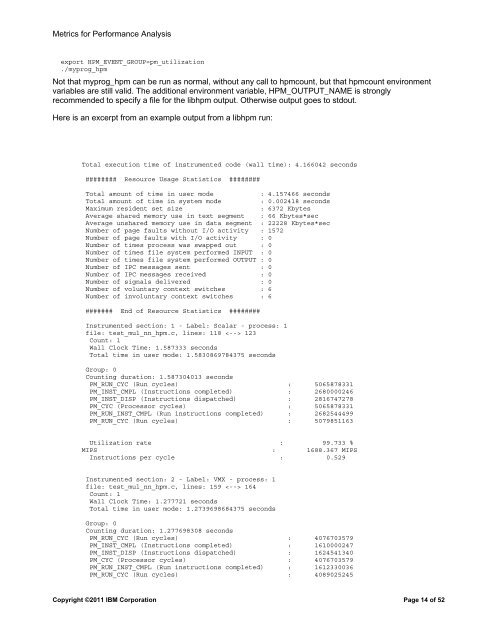
<strong>Metrics</strong> <strong>for</strong> Per<strong>for</strong>mance <strong>Analysis</strong>export HPM_EVENT_GROUP=pm_utilization./myprog_hpmNot that myprog_hpm can be run as normal, without any call to hpmcount, but that hpmcount environmentvariables are still valid. The additional environment variable, HPM_OUTPUT_NAME is stronglyrecommended to specify a file <strong>for</strong> the libhpm output. Otherwise output goes to stdout.Here is an excerpt from an example output from a libhpm run:Total execution time of instrumented code (wall time): 4.166042 seconds######## Resource Usage Statistics ########Total amount of time in user mode: 4.157466 secondsTotal amount of time in system mode: 0.002418 secondsMaximum resident set size: 6372 KbytesAverage shared memory use in text segment : 66 Kbytes*secAverage unshared memory use in data segment : 22228 Kbytes*secNumber of page faults without I/O activity : 1572Number of page faults with I/O activity : 0Number of times process was swapped out : 0Number of times file system per<strong>for</strong>med INPUT : 0Number of times file system per<strong>for</strong>med OUTPUT : 0Number of IPC messages sent : 0Number of IPC messages received : 0Number of signals delivered : 0Number of voluntary context switches : 6Number of involuntary context switches : 6####### End of Resource Statistics ########Instrumented section: 1 - Label: Scalar - process: 1file: test_mul_nn_hpm.c, lines: 118 123Count: 1Wall Clock Time: 1.587333 secondsTotal time in user mode: 1.5830869784375 secondsGroup: 0Counting duration: 1.587304013 secondsPM_RUN_CYC (Run cycles) : 5065878331PM_INST_CMPL (Instructions completed) : 2680000246PM_INST_DISP (Instructions dispatched) : 2816747278PM_CYC (Processor cycles) : 5065878331PM_RUN_INST_CMPL (Run instructions completed) : 2682544499PM_RUN_CYC (Run cycles) : 5079851163Utilization rate : 99.733 %MIPS : 1688.367 MIPSInstructions per cycle : 0.529Instrumented section: 2 - Label: VMX - process: 1file: test_mul_nn_hpm.c, lines: 159 164Count: 1Wall Clock Time: 1.277721 secondsTotal time in user mode: 1.2739698684375 secondsGroup: 0Counting duration: 1.277698308 secondsPM_RUN_CYC (Run cycles) : 4076703579PM_INST_CMPL (Instructions completed) : 1610000247PM_INST_DISP (Instructions dispatched) : 1624541340PM_CYC (Processor cycles) : 4076703579PM_RUN_INST_CMPL (Run instructions completed) : 1612330036PM_RUN_CYC (Run cycles) : 4089025245Copyright ©2011 IBM Corporation Page 14 of 52