Issue for October - December 2011 - National Institute of Rural ...
Issue for October - December 2011 - National Institute of Rural ...
Issue for October - December 2011 - National Institute of Rural ...

You also want an ePaper? Increase the reach of your titles
YUMPU automatically turns print PDFs into web optimized ePapers that Google loves.
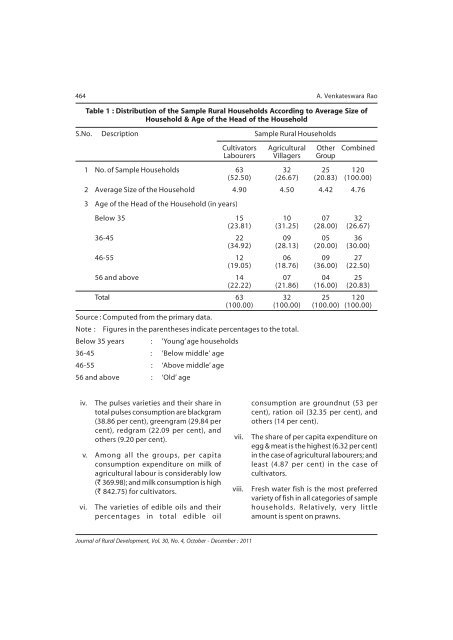
464 A. Venkateswara RaoTable 1 : Distribution <strong>of</strong> the Sample <strong>Rural</strong> Households According to Average Size <strong>of</strong>Household & Age <strong>of</strong> the Head <strong>of</strong> the HouseholdS.No. Description Sample <strong>Rural</strong> HouseholdsCultivators Agricultural Other CombinedLabourers Villagers Group1 No. <strong>of</strong> Sample Households 63 32 25 120(52.50) (26.67) (20.83) (100.00)2 Average Size <strong>of</strong> the Household 4.90 4.50 4.42 4.763 Age <strong>of</strong> the Head <strong>of</strong> the Household (in years)Below 35 15 10 07 32(23.81) (31.25) (28.00) (26.67)36-45 22 09 05 36(34.92) (28.13) (20.00) (30.00)46-55 12 06 09 27(19.05) (18.76) (36.00) (22.50)56 and above 14 07 04 25(22.22) (21.86) (16.00) (20.83)Total 63 32 25 120(100.00) (100.00) (100.00) (100.00)Source : Computed from the primary data.Note : Figures in the parentheses indicate percentages to the total.Below 35 years : ‘Young’ age households36-45 : ‘Below middle’ age46-55 : ‘Above middle’ age56 and above : ‘Old’ ageiv.The pulses varieties and their share intotal pulses consumption are blackgram(38.86 per cent), greengram (29.84 percent), redgram (22.09 per cent), andothers (9.20 per cent).v. Among all the groups, per capitaconsumption expenditure on milk <strong>of</strong>agricultural labour is considerably low(` 369.98); and milk consumption is high(` 842.75) <strong>for</strong> cultivators.vi.The varieties <strong>of</strong> edible oils and theirpercentages in total edible oilvii.viii.consumption are groundnut (53 percent), ration oil (32.35 per cent), andothers (14 per cent).The share <strong>of</strong> per capita expenditure onegg & meat is the highest (6.32 per cent)in the case <strong>of</strong> agricultural labourers; andleast (4.87 per cent) in the case <strong>of</strong>cultivators.Fresh water fish is the most preferredvariety <strong>of</strong> fish in all categories <strong>of</strong> samplehouseholds. Relatively, very littleamount is spent on prawns.Journal <strong>of</strong> <strong>Rural</strong> Development, Vol. 30, No. 4, <strong>October</strong> - <strong>December</strong> : <strong>2011</strong>