Issue for October - December 2011 - National Institute of Rural ...
Issue for October - December 2011 - National Institute of Rural ...
Issue for October - December 2011 - National Institute of Rural ...

Create successful ePaper yourself
Turn your PDF publications into a flip-book with our unique Google optimized e-Paper software.
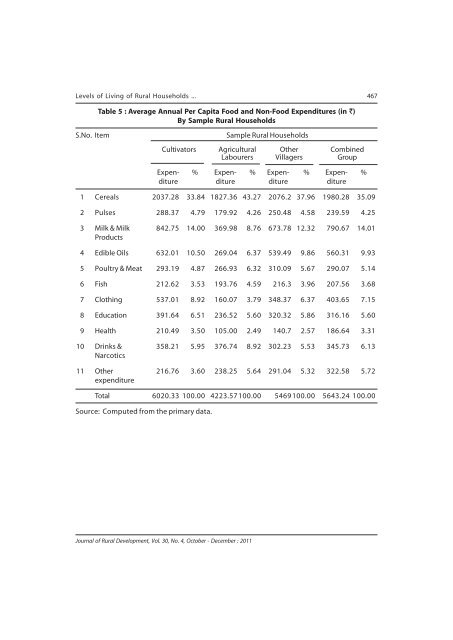
Levels <strong>of</strong> Living <strong>of</strong> <strong>Rural</strong> Households ... 467Table 5 : Average Annual Per Capita Food and Non-Food Expenditures (in `)By Sample <strong>Rural</strong> HouseholdsS.No. ItemSample <strong>Rural</strong> HouseholdsCultivators Agricultural Other CombinedLabourers Villagers GroupExpen- % Expen- % Expen- % Expen- %diture diture diture diture1 Cereals 2037.28 33.84 1827.36 43.27 2076.2 37.96 1980.28 35.092 Pulses 288.37 4.79 179.92 4.26 250.48 4.58 239.59 4.253 Milk & Milk 842.75 14.00 369.98 8.76 673.78 12.32 790.67 14.01Products4 Edible Oils 632.01 10.50 269.04 6.37 539.49 9.86 560.31 9.935 Poultry & Meat 293.19 4.87 266.93 6.32 310.09 5.67 290.07 5.146 Fish 212.62 3.53 193.76 4.59 216.3 3.96 207.56 3.687 Clothing 537.01 8.92 160.07 3.79 348.37 6.37 403.65 7.158 Education 391.64 6.51 236.52 5.60 320.32 5.86 316.16 5.609 Health 210.49 3.50 105.00 2.49 140.7 2.57 186.64 3.3110 Drinks & 358.21 5.95 376.74 8.92 302.23 5.53 345.73 6.13Narcotics11 Other 216.76 3.60 238.25 5.64 291.04 5.32 322.58 5.72expenditureTotal 6020.33 100.00 4223.57100.00 5469100.00 5643.24 100.00Source: Computed from the primary data.Journal <strong>of</strong> <strong>Rural</strong> Development, Vol. 30, No. 4, <strong>October</strong> - <strong>December</strong> : <strong>2011</strong>