Science Literacy 2006 school release materials - NAP
Science Literacy 2006 school release materials - NAP
Science Literacy 2006 school release materials - NAP

Create successful ePaper yourself
Turn your PDF publications into a flip-book with our unique Google optimized e-Paper software.
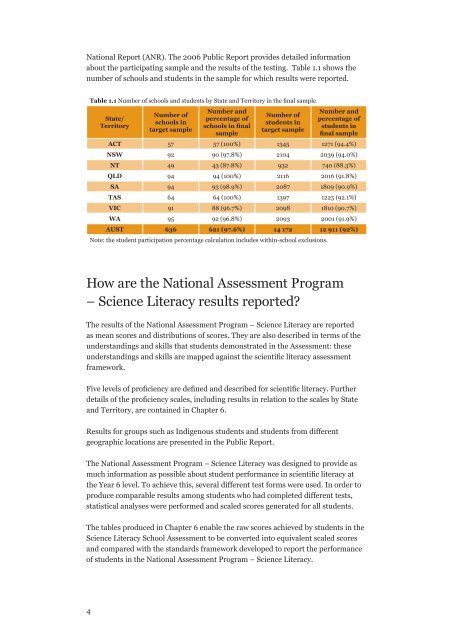
National Report (ANR). The <strong>2006</strong> Public Report provides detailed informationabout the participating sample and the results of the testing. Table 1.1 shows thenumber of <strong>school</strong>s and students in the sample for which results were reported.Table 1.1 Number of <strong>school</strong>s and students by State and Territory in the final sampleState/TerritoryNumber of<strong>school</strong>s intarget sampleNumber andpercentage of<strong>school</strong>s in finalsampleNumber ofstudents intarget sampleNumber andpercentage ofstudents infinal sampleACT 57 57 (100%) 1345 1271 (94.4%)NSW 92 90 (97.8%) 2104 2039 (94.0%)NT 49 43 (87.8%) 932 740 (88.3%)QLD 94 94 (100%) 2116 2016 (91.8%)SA 94 93 (98.9%) 2087 1809 (90.9%)TAS 64 64 (100%) 1397 1225 (92.1%)VIC 91 88 (96.7%) 2098 1810 (90.7%)WA 95 92 (96.8%) 2093 2001 (91.9%)AUST 636 621 (97.6%) 14 172 12 911 (92%)Note: the student participation percentage calculation includes within-<strong>school</strong> exclusions.How are the National Assessment Program– <strong>Science</strong> <strong>Literacy</strong> results reported?The results of the National Assessment Program – <strong>Science</strong> <strong>Literacy</strong> are reportedas mean scores and distributions of scores. They are also described in terms of theunderstandings and skills that students demonstrated in the Assessment: theseunderstandings and skills are mapped against the scientific literacy assessmentframework.Five levels of proficiency are defined and described for scientific literacy. Furtherdetails of the proficiency scales, including results in relation to the scales by Stateand Territory, are contained in Chapter 6.Results for groups such as Indigenous students and students from differentgeographic locations are presented in the Public Report.The National Assessment Program – <strong>Science</strong> <strong>Literacy</strong> was designed to provide asmuch information as possible about student performance in scientific literacy atthe Year 6 level. To achieve this, several different test forms were used. In order toproduce comparable results among students who had completed different tests,statistical analyses were performed and scaled scores generated for all students.The tables produced in Chapter 6 enable the raw scores achieved by students in the<strong>Science</strong> <strong>Literacy</strong> School Assessment to be converted into equivalent scaled scoresand compared with the standards framework developed to report the performanceof students in the National Assessment Program – <strong>Science</strong> <strong>Literacy</strong>.