Post-harvest profile of red gram - Agmarknet
Post-harvest profile of red gram - Agmarknet
Post-harvest profile of red gram - Agmarknet

You also want an ePaper? Increase the reach of your titles
YUMPU automatically turns print PDFs into web optimized ePapers that Google loves.
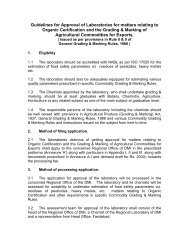
Area, production and yield <strong>of</strong> Red <strong>gram</strong> in major producing states <strong>of</strong> India during 1999-2000 to2001-2002 are given under:Major Red <strong>gram</strong> producing states during 2001-2002(Percent to all India production)33.49%Maharashtra19.73%Uttar Pradesh11.96%12.18%Madhya PradeshAndhra PradeshGujaratKarnataka6.34%8.13%8.17%OthersTable No. 4: Area, production and yield <strong>of</strong> Red <strong>gram</strong> in major producing statesState Area (‘000 Hectares) Production (‘000 Tonnes) Yield (kg/ha)1999-2000-1999-2000-1999-2000- 2001-2000 2001 2001-2002 2000 2001 2001-20022000 2001 2002(F inal) %(Final) %(Final)Andhra Pradesh 432.2 513 419 12. 4 154.8 219 188 8.17 358 427 449Bihar 66.5 43.7 42 1.24 82.1 58.9 53.8 2.34 1235 1348 1281Gujarat 358 317.9 332.3 9.84 290.8 107.2 187 8.13 812 337 563Karnataka 508.1 582.7 482 14.27 289.5 263.5 146 6.34 570 452 303Madhya Pradesh 317.3 312.9 334.9 9.91 270.9 210.4 280.3 12.18 854 672 837Maharashtra 1041 1096.1 1017.3 30.11 868 660.3 770.6 33.49 834 602 757Orissa 136 149 141.6 4.19 85 75 78.6 3.42 625 503 555Tamil Nadu 87.8 63.3 63.4 1.88 62.4 45.1 41.7 1.81 711 712 658Uttar Pradesh 414.7 406.6 397.4 11.76 544 509.8 454 19.73 1312 1254 1142Others 65.4 147.1 148.6 4.4 46.5 97.3 101.1 4.39 711 661 680All India 3427 3632.3 3378.5 100 2694 2246.5 2301.1 100 786 618 681Source: Department <strong>of</strong> Agriculture and Cooperation, New Delhi.4