Annual Report 2005
Annual Report 2005
Annual Report 2005

Create successful ePaper yourself
Turn your PDF publications into a flip-book with our unique Google optimized e-Paper software.
32<br />
Course of business and Group’s state of affairs:<br />
Turnover development<br />
During the past financial year, the consolidated<br />
turnover fell by 2.9% from 140.3 million Euros<br />
to 136.2 million Euros. Excluding the foam<br />
board company in the USA and the UK which<br />
was shut down in 2004 and <strong>2005</strong>, this corresponds<br />
to a drop of 1.7% which is primarily due<br />
to delivery problems in some areas of trading.<br />
Another reason for the drop were the planned<br />
adjustments made to product ranges at<br />
NESCHEN AG. All in all, we saw an increased<br />
stabilisation of the markets in <strong>2005</strong>.<br />
During the last few years, the consolidated<br />
companies have changed considerably owing<br />
to the drop in investments at NESCHEN Vinywin<br />
and NESCHEN Polska. The shutdown of the<br />
direct foam board company in the USA (<strong>2005</strong>)<br />
and the sale of the foam board company in the<br />
UK (2004) have lead to a reduction in the volume<br />
of sales. The US production company is a<br />
joint venture in which NESCHEN holds a 50%<br />
interest which is not fully consolidated but<br />
shown at equity.<br />
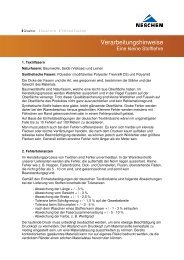
Turnover distribution by region<br />
in €k (from 2004 in accordance with IFRS)<br />
■ USA / Asia ■ EU-countries ■ Germany<br />
160,000<br />
140,000<br />
120,000<br />
100,000<br />
80,000<br />
60,000<br />
40,000<br />
20,000<br />
0<br />
49.7 % 34.1 %<br />
16.2 %<br />
2003<br />
49.4 % 33.0 %<br />
17.6 %<br />
2004<br />
48.2 % 33.3 %<br />
18.5 %<br />
<strong>2005</strong><br />
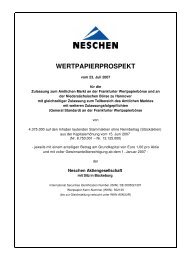
Turnover development<br />
in €k (from 2004 in accordance with IFRS)<br />
Excluding the companies shut down as described above (amounting to<br />
approximately 16 million Euros per annum) and the effects of exchange<br />
rates, turnover has been virtually constant since 2002.<br />
170,000<br />
150,000<br />
130,000<br />
110,000<br />
90,000<br />
70,000<br />
50,000<br />
0<br />
54,667<br />
1998<br />
70,024<br />
83,948<br />
112,411<br />
1999 2000 2001<br />
160,106<br />
2002<br />
140,941<br />
140,308<br />
136,174<br />
2003 2004 <strong>2005</strong>