Washington Metropolitan Area Transit AuthorityFY 2009 <strong>Comprehensive</strong> <strong>Annual</strong> <strong>Financial</strong> <strong>Report</strong>Management's Discussion and AnalysisAs management of <strong>the</strong> Washington Metropolitan Area Transit Authority (Authority), we offer readers of <strong>the</strong>basic financial statements this overview and analysis of <strong>the</strong> financial activities of <strong>the</strong> Authority as of June30, 2009, 2008 and 2007 and <strong>for</strong> <strong>the</strong> years ended June 30, 2009, 2008 and 2007. This discussion andanalysis is designed to assist <strong>the</strong> reader in focusing on significant financial issues and activities and toidentify any noteworthy changes in financial position. We encourage readers to consider <strong>the</strong> in<strong>for</strong>mationpresented here in conjunction with <strong>the</strong> basic financial statements taken as a whole.Fiscal Year 2009 <strong>Financial</strong> Highlights• Net assets increased by $93.5 million or 1.2 percent due primarily to increased capitalcontributions.• Capital assets be<strong>for</strong>e depreciation and amortization increased by $323.6 million, largely attributableto new rail car and bus purchases, facilities enhancements, and rail rehabilitation. Capitalcontributions were $578.3 million.• Current liabilities decreased by $432.5 million or 44.6 percent, decrease due to <strong>the</strong> repayment of<strong>the</strong> line of credit debt and replacement of <strong>com</strong>mercial paper with long-term bonds.• Operating revenues increased by $54.7 million or 7.9 percent, due to a mid-year fare increaseeffective January 2008, and an increase in ridership. Special capital region events such as <strong>the</strong>Presidential Inauguration and sporting events contributed to <strong>the</strong> increase in revenue and ridership.• Operating expenses increased by $101.7 million or 5.6 percent, due primarily to an increase inwages, pension plan contributions and workers <strong>com</strong>pensation claims reserves, and investments inrisk and safety assessments. In addition, <strong>the</strong> continuous growth of <strong>the</strong> Authority's paratransitservice and propulsion power usage, also contributed to this increase in expenses. Operatingexpenses include <strong>the</strong> increase in estimated liability <strong>for</strong> injury and damage claims related to <strong>the</strong> June22, 2009 rail car accident.Overview of <strong>the</strong> Basic <strong>Financial</strong> StatementsThis required annual report consists of three parts: Management's Discussion and Analysis, Basic <strong>Financial</strong>Statements and Required Supplementary In<strong>for</strong>mation. The basic financial statements also include notesthat provide in more detail some of <strong>the</strong> in<strong>for</strong>mation in <strong>the</strong> basic financial statements.Basic <strong>Financial</strong> Statements. The Authority's basic financial statements are prepared in con<strong>for</strong>mity withgenerally accepted accounting principles in <strong>the</strong> United States of America (GAAP) as applied to an enterpriseusing <strong>the</strong> accrual basis of accounting. Under this basis, revenues are recognized in <strong>the</strong> period in which <strong>the</strong>yare earned, and expenses are recognized in <strong>the</strong> period in which <strong>the</strong>y are incurred.The Authority's basic financial statements are <strong>the</strong> Statements of Net Assets, <strong>the</strong> Statements of Revenues,Expenses and Changes in Net Assets and <strong>the</strong> Statement of Cash Flows.The Statements of Net Assets report <strong>the</strong> Authority's net assets. Net assets, <strong>the</strong> difference between assetsand liabilities, are one way to measure <strong>the</strong> financial position of <strong>the</strong> Authority. This is only one measure,however, and <strong>the</strong> reader should consider o<strong>the</strong>r indicators, such as <strong>the</strong> rate of growth of operating subsidies,passenger fare levels, ridership, general economic conditions in <strong>the</strong> metropolitan area and <strong>the</strong> age andcondition of capital assets used by <strong>the</strong> Authority.The Statements of Revenues, Expenses and Changes in Net Assets report all of <strong>the</strong> revenues earned andexpenses incurred during <strong>the</strong> reporting periods.The Statement of Cash Flows provide in<strong>for</strong>mation on cash receipts and cash payments during <strong>the</strong> reportingperiods.The basic financial statements can be found on pages 21-25 of this report.11
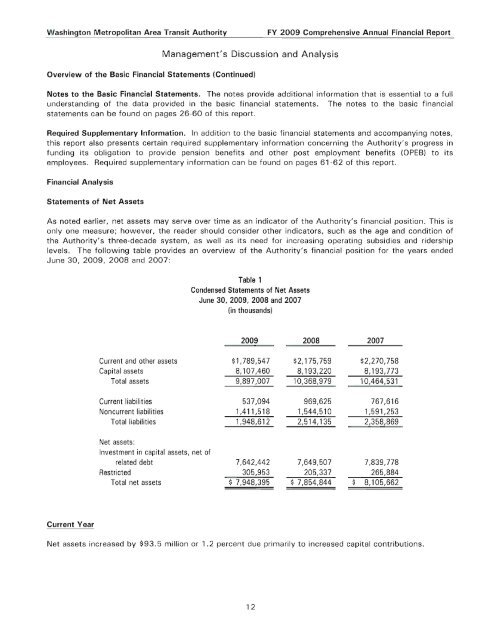
Washington Metropolitan Area Transit AuthorityFY 2009 <strong>Comprehensive</strong> <strong>Annual</strong> <strong>Financial</strong> <strong>Report</strong>Management's Discussion and AnalysisOverview of <strong>the</strong> Basic <strong>Financial</strong> Statements (Continued)Notes to <strong>the</strong> Basic <strong>Financial</strong> Statements. The notes provide additional in<strong>for</strong>mation that is essential to a fullunderstanding of <strong>the</strong> data provided in <strong>the</strong> basic financial statements. The notes to <strong>the</strong> basic financialstatements can be found on pages 26-60 of this report.Required Supplementary In<strong>for</strong>mation. In addition to <strong>the</strong> basic financial statements and ac<strong>com</strong>panying notes,this report also presents certain required supplementary in<strong>for</strong>mation concerning <strong>the</strong> Authority's progress infunding its obligation to provide pension benefits and o<strong>the</strong>r post employment benefits (OPES) to itsemployees. Required supplementary in<strong>for</strong>mation can be found on pages 61-62 of this report.<strong>Financial</strong> AnalysisStatements of Net AssetsAs noted earlier, net assets may serve over time as an indicator of <strong>the</strong> Authority's financial position. This isonly one measure; however, <strong>the</strong> reader should consider o<strong>the</strong>r indicators, such as <strong>the</strong> age and condition of<strong>the</strong> Authority's three-decade system, as well as its need <strong>for</strong> increasing operating subsidies and ridershiplevels. The following table provides an overview of <strong>the</strong> Authority's financial position <strong>for</strong> <strong>the</strong> years endedJune 30, 2009, 2008 and 2007:Table 1Condensed Statements of Net AssetsJune 30, 2009, 2008 and 2007(in thousands)2009 2008 2007Current and o<strong>the</strong>r assets $1,789,547 $2,175,759 $2,270,758Capital assets 8,107,460 8,193,220 8,193,773Total assets 9,897,007 10,368,979 10,464,531Current liabilities 537,094 969,625 767,616Noncurrent liabilities 1,411,518 1,544,510 1,591,253Total liabilities 1,948,612 2,514,135 2,358,869Net assets:Investment in capital assets, net ofrelated debt 7,642,442 7,649,507 7,839,778Restricted 305,953 205,337 265,884Total net assets $ 7,948,395 $ 7,854,844 $ 8,105,662Current YearNet assets increased by $93.5 million or 1.2 percent due primarily to increased capital contributions.12