Comprehensive Annual Financial Report for the ... - WMATA.com
Comprehensive Annual Financial Report for the ... - WMATA.com
Comprehensive Annual Financial Report for the ... - WMATA.com
- No tags were found...

Create successful ePaper yourself
Turn your PDF publications into a flip-book with our unique Google optimized e-Paper software.
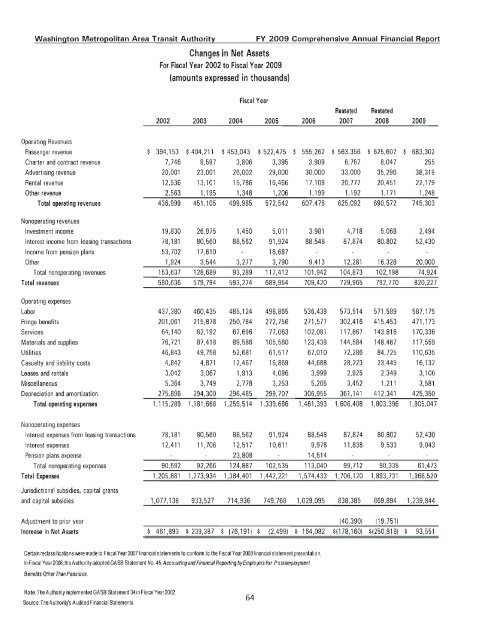
Washington Metropolitan Area Transit AuthorityChanges in Net AssetsFor Fiscal Year 2002 to Fiscal Year 2009(amounts expressed in thousands)FY 2009 <strong>Comprehensive</strong> <strong>Annual</strong> <strong>Financial</strong> <strong>Report</strong>Fiscal YearRestated Restated2002 2003 2004 2005 2006 2007 2008 2009Operating RevenuesPassenger revenue 394,153 $ 404,211 $ 453,043 $ 522,475 $ 555,262 $ 563,356 $ 625,607 683,302Charter and contract revenue 7,746 9,597 3,806 3,395 3,909 6,767 8,047 255Adverti si ng revenue 20,001 23,001 26,002 29,000 30,000 33,000 35,296 38,319Rental revenue 12,536 13,101 15,786 16,466 17,108 20,777 20,451 22,179O<strong>the</strong>r revenue 2,563 1,195 1,348 1,206 1,199 1,192 1,171 1,248Total operating revenues 436,999 451,105 499,985 572,542 607,478 625,092 690,572 745,303Nonoperating revenuesInvestment in<strong>com</strong>e 19,830 26,975 1,450 5,011 3,981 4,718 5,068 2,494Interest in<strong>com</strong>e from leasing transactions 78,181 80,560 88,562 91,924 88,548 87,874 80,802 52,430In<strong>com</strong>e from pension plans 53,702 17,610 16,687O<strong>the</strong>r 1,924 3,544 3,277 3,790 9,413 12,281 16,328 20,000Total nonoperating revenues 153,637 128,689 93,289 117,412 101,942 104,873 102,198 74,924Total revenues 590,636 579,794 593,274 689,954 709,420 729,965 792,770 820,227Operating expensesLabor 437,380 460,435 485,124 498,865 536,439 573,514 571,589 587,175Fringe benefits 201,061 215,878 250,784 272,756 271,577 302,416 415,453 471,173Services 64,140 62,192 67,696 77,063 102,081 117,867 143,816 170,336Materials and supplies 76,721 87,418 89,586 105,560 123,439 144,584 148,467 117,559Utilities 46,843 49,758 52,681 61,517 67,010 72,286 84,725 110,635Casualty and liability costs 4,842 4,871 12,467 16,869 44,688 28,223 23,445 16,132Leases and rentals 3,042 3,067 1,913 4,096 3,999 2,925 2,349 3,106Miscellaneous 5,364 3,749 2,778 3,253 5,205 3,452 1,211 3,581Depreciation and amortization 275,896 294,300 296,485 299,707 306,955 361,141 412,341 425,350Total operating expenses 1,115,289 1,181,668 1,259,514 1,339,686 1,461,393 1,606,408 1,803,396 1,905,047Nonoperating expensesInterest expenses from leasing transactions 78,181 80,560 88,562 91,924 88,548 87,874 80,802 52,430Interest expenses 12,411 11,706 12,517 10,611 9,978 11,838 9,533 9,043Pension plans expense 23,808 14,514Total nonoperating expenses 90,592 92,266 124,887 102,535 113,040 99,712 90,335 61,473Total Expenses 1,205,881 1,273,934 1,384,401 1,442,221 1,574,433 1,706,120 1,893,731 1,966,520Jurisdictional subsidies, capital grantsand capital subsidies 1,077,138 933,527 714,936 749,768 1,029,095 838,385 869,894 1,239,844Adjustment to prior year (40,3901 (19,751)Increase in Net Assets $ 461,893 $ 239,387 $ 176,1911 $ (2,499) $ 164,082 $(178,1601 $(250,818) $ 93,551Certain reclassifications were made to Fiscal Year 2007 financial statements to con<strong>for</strong>m 10 <strong>the</strong> Fiscal Year 2008 financial statement presentation.In Fiscal Year 2008, <strong>the</strong> Authority adopted GASB Statement No. 45, Accounting and <strong>Financial</strong> <strong>Report</strong>ing by Emplo}€fS <strong>for</strong> Pos/employmentBenefits O<strong>the</strong>r Than Pensions.Note: The Authorityimplemented GASB Statement 34 in Fiscal Year 2002.Source: The Authorilys Audited <strong>Financial</strong> Statements.64