Comprehensive Annual Financial Report for the ... - WMATA.com
Comprehensive Annual Financial Report for the ... - WMATA.com
Comprehensive Annual Financial Report for the ... - WMATA.com
- No tags were found...

Create successful ePaper yourself
Turn your PDF publications into a flip-book with our unique Google optimized e-Paper software.
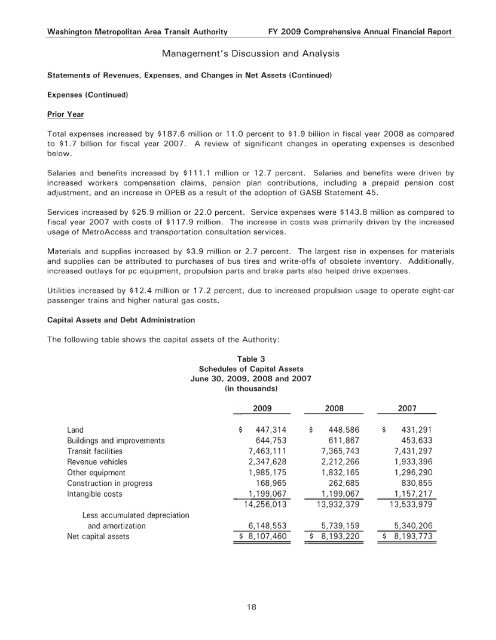
Washington Metropolitan Area Transit AuthorityFY 2009 <strong>Comprehensive</strong> <strong>Annual</strong> <strong>Financial</strong> <strong>Report</strong>Management's Discussion and AnalysisStatements of Revenues, Expenses, and Changes in Net Assets (Continued)Expenses (Continued)Prior YearTotal expenses increased by $187.6 million or 11.0 percent to $1.9 billion in fiscal year 2008 as <strong>com</strong>paredto $1.7 billion <strong>for</strong> fiscal year 2007. A review of significant changes in operating expenses is describedbelow.Salaries and benefits increased by $111.1 million or 12.7 percent. Salaries and benefits were driven byincreased workers <strong>com</strong>pensation claims, pension plan contributions, including a prepaid pension costadjustment, and an increase in OPEB as a result of <strong>the</strong> adoption of GASB Statement 45.Services increased by $25.9 million or 22.0 percent. Service expenses were $143.8 million as <strong>com</strong>pared tofiscal year 2007 with costs of $117.9 million. The increase in costs was primarily driven by <strong>the</strong> increasedusage of MetroAccess and transportation consultation services.Materials and supplies increased by $3.9 million or 2.7 percent. The largest rise in expenses <strong>for</strong> materialsand supplies can be attributed to purchases of bus tires and write-offs of obsolete inventory. Additionally,increased outlays <strong>for</strong> pc equipment, propulsion parts and brake parts also helped drive expenses.Utilities increased by $12.4 million or 17.2 percent, due to increased propulsion usage to operate eight-carpassenger trains and higher natural gas costs.Capital Assets and Debt AdministrationThe following table shows <strong>the</strong> capital assets of <strong>the</strong> Authority:Table 3Schedules of Capital AssetsJune 30, 2009, 2008 and 2007(in thousands)2009 2008 2007Land $ 447,314 $ 448,586 $ 431,291Buildings and improvements 644,753 611,867 453,633Transit facilities 7,463,111 7,365,743 7,431,297Revenue vehicles 2,347,628 2,212,266 1,933,396O<strong>the</strong>r equipment 1,985,175 1,832,165 1,296,290Construction in progress 168,965 262,685 830,855Intangible costs 1,199,067 1,199,067 1,157,21714,256,013 13,932,379 13,533,979Less accumulated depreciationand amortization 6,148,553 5,739,159 5,340,206Net capital assets $ 8,107,460 $ 8,193,220 $ 8,193,77318