Comprehensive Annual Financial Report for the ... - WMATA.com
Comprehensive Annual Financial Report for the ... - WMATA.com
Comprehensive Annual Financial Report for the ... - WMATA.com
- No tags were found...

You also want an ePaper? Increase the reach of your titles
YUMPU automatically turns print PDFs into web optimized ePapers that Google loves.
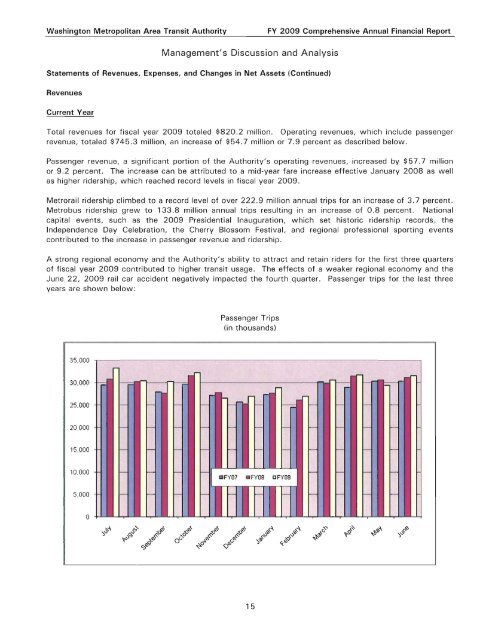
Washington Metropolitan Area Transit AuthorityFY 2009 <strong>Comprehensive</strong> <strong>Annual</strong> <strong>Financial</strong> <strong>Report</strong>Management's Discussion and AnalysisStatements of Revenues, Expenses, and Changes in Net Assets (Continued)RevenuesCurrent YearTotal revenues <strong>for</strong> fiscal year 2009 totaled $820.2 million. Operating revenues, which include passengerrevenue, totaled $745.3 million, an increase of $54.7 million or 7.9 percent as described below.Passenger revenue, a significant portion of <strong>the</strong> Authority's operating revenues, increased by $57.7 millionor 9.2 percent. The increase can be attributed to a mid-year fare increase effective January 2008 as wellas higher ridership, which reached record levels in fiscal year 2009.Metrorail ridership climbed to a record level of over 222.9 million annual trips <strong>for</strong> an increase of 3.7 percent.Metrobus ridership grew to 133.8 million annual trips resulting in an increase of 0.8 percent. Nationalcapital events, such as <strong>the</strong> 2009 Presidential Inauguration, which set historic ridership records, <strong>the</strong>Independence Day Celebration, <strong>the</strong> Cherry Blossom Festival, and regional professional sporting eventscontributed to <strong>the</strong> increase in passenger revenue and ridership.A strong regional economy and <strong>the</strong> Authority's ability to attract and retain riders <strong>for</strong> <strong>the</strong> first three quartersof fiscal year 2009 contributed to higher transit usage. The effects of a weaker regional economy and <strong>the</strong>June 22, 2009 rail car accident negatively impacted <strong>the</strong> fourth quarter. Passenger trips <strong>for</strong> <strong>the</strong> last threeyears are shown below:Passenger Trips(in thousands)35,00030,00025,000---=r-r-- r-.-1--;:: - ,..--- - -- - -r-- ..- r-r--I--- - I- -- ~- i--;: - I---20.000I--- - I-- - -I-- ~ - -I--15.000- I-- - I- - - l- f-- - l- I-10,0005,000I""I--- - I-- ~ - I-- I--FY07 .FY08 CFY09....I--- - I-- - -I-- ~ - I-- I--o'-'-15